Key Takeaways
- BTC printed a May 28 intraday high of $76,047, staying well below the $78,000 trend reversal zone.
- The MACD level at -550 and momentum at -3,253 confirmed bearish momentum remains active in BTC.
- BTC bulls need a reclaim of $77,000-$78,000 to shift the 4-hour and daily bias away from bears.
Bitcoin Chart Outlook
The 1-hour chart showed bitcoin consolidating around $73,000 after buyers defended the $72,600 support level. That defense, while notable, came with fading volume, a pattern that puts the conviction of short-term bulls into question. Local resistance sat in the $73,800-$74,200 zone, with $75,500 representing a more formidable ceiling above.
Momentum on the shorter timeframe remained neutral to bearish, and any meaningful push to the upside would require a clean candle close above local resistance levels with accompanying volume to suggest the move carries weight. Until that confirmation arrives, bitcoin’s price action on the 1-hour chart reads as consolidation within a broader downtrend rather than a base-building phase for recovery.
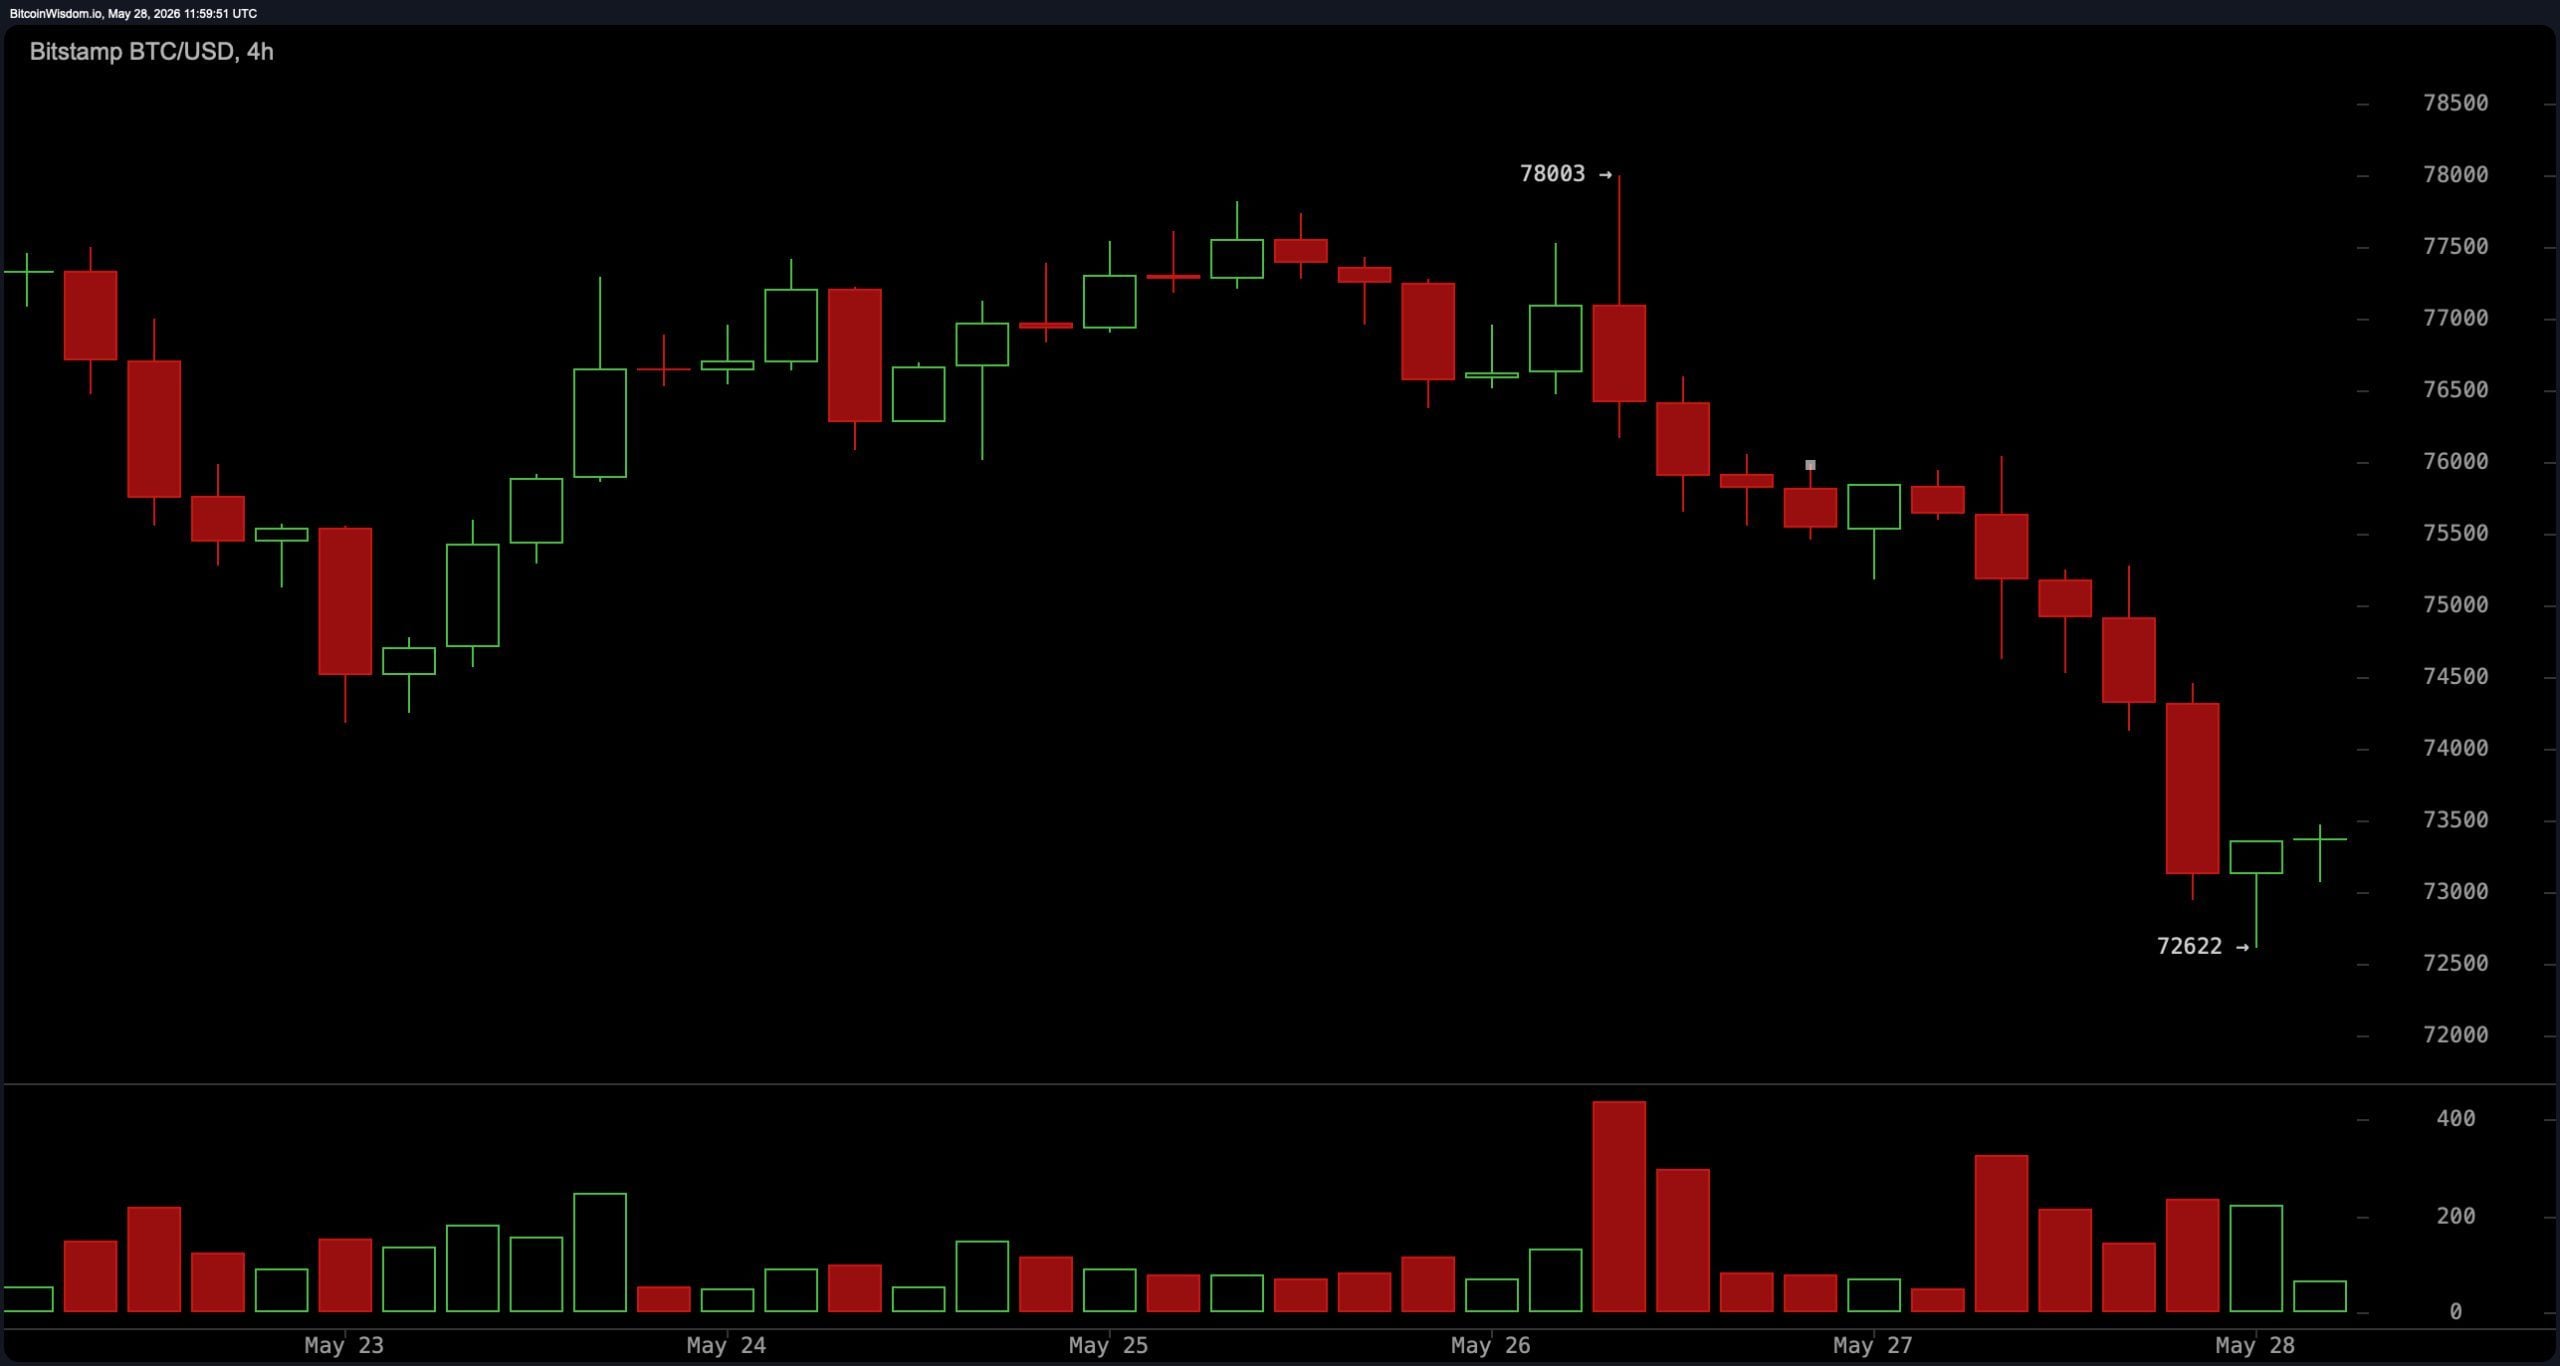
The 4-hour chart confirmed the bearish continuation structure that defined the prior trading sessions. Bitcoin broke below $75,000 and printed a sharp move into $72,600, which appeared to represent a capitulation leg rather than an organic correction. The current bounce from that level carried the characteristics of a relief rally, shallow, low-conviction, and occurring in a structure that has yet to produce a higher high.
Higher highs and lower lows across the 4-hour timeframe told a clear story: sellers were in control between $75,000 and $78,000, and the burden of proof rested with bulls to reclaim that range before any shift in medium-term bias could be considered credible. The $77,000-$78,000 area remained the trend reversal zone that technicians were monitoring closely.
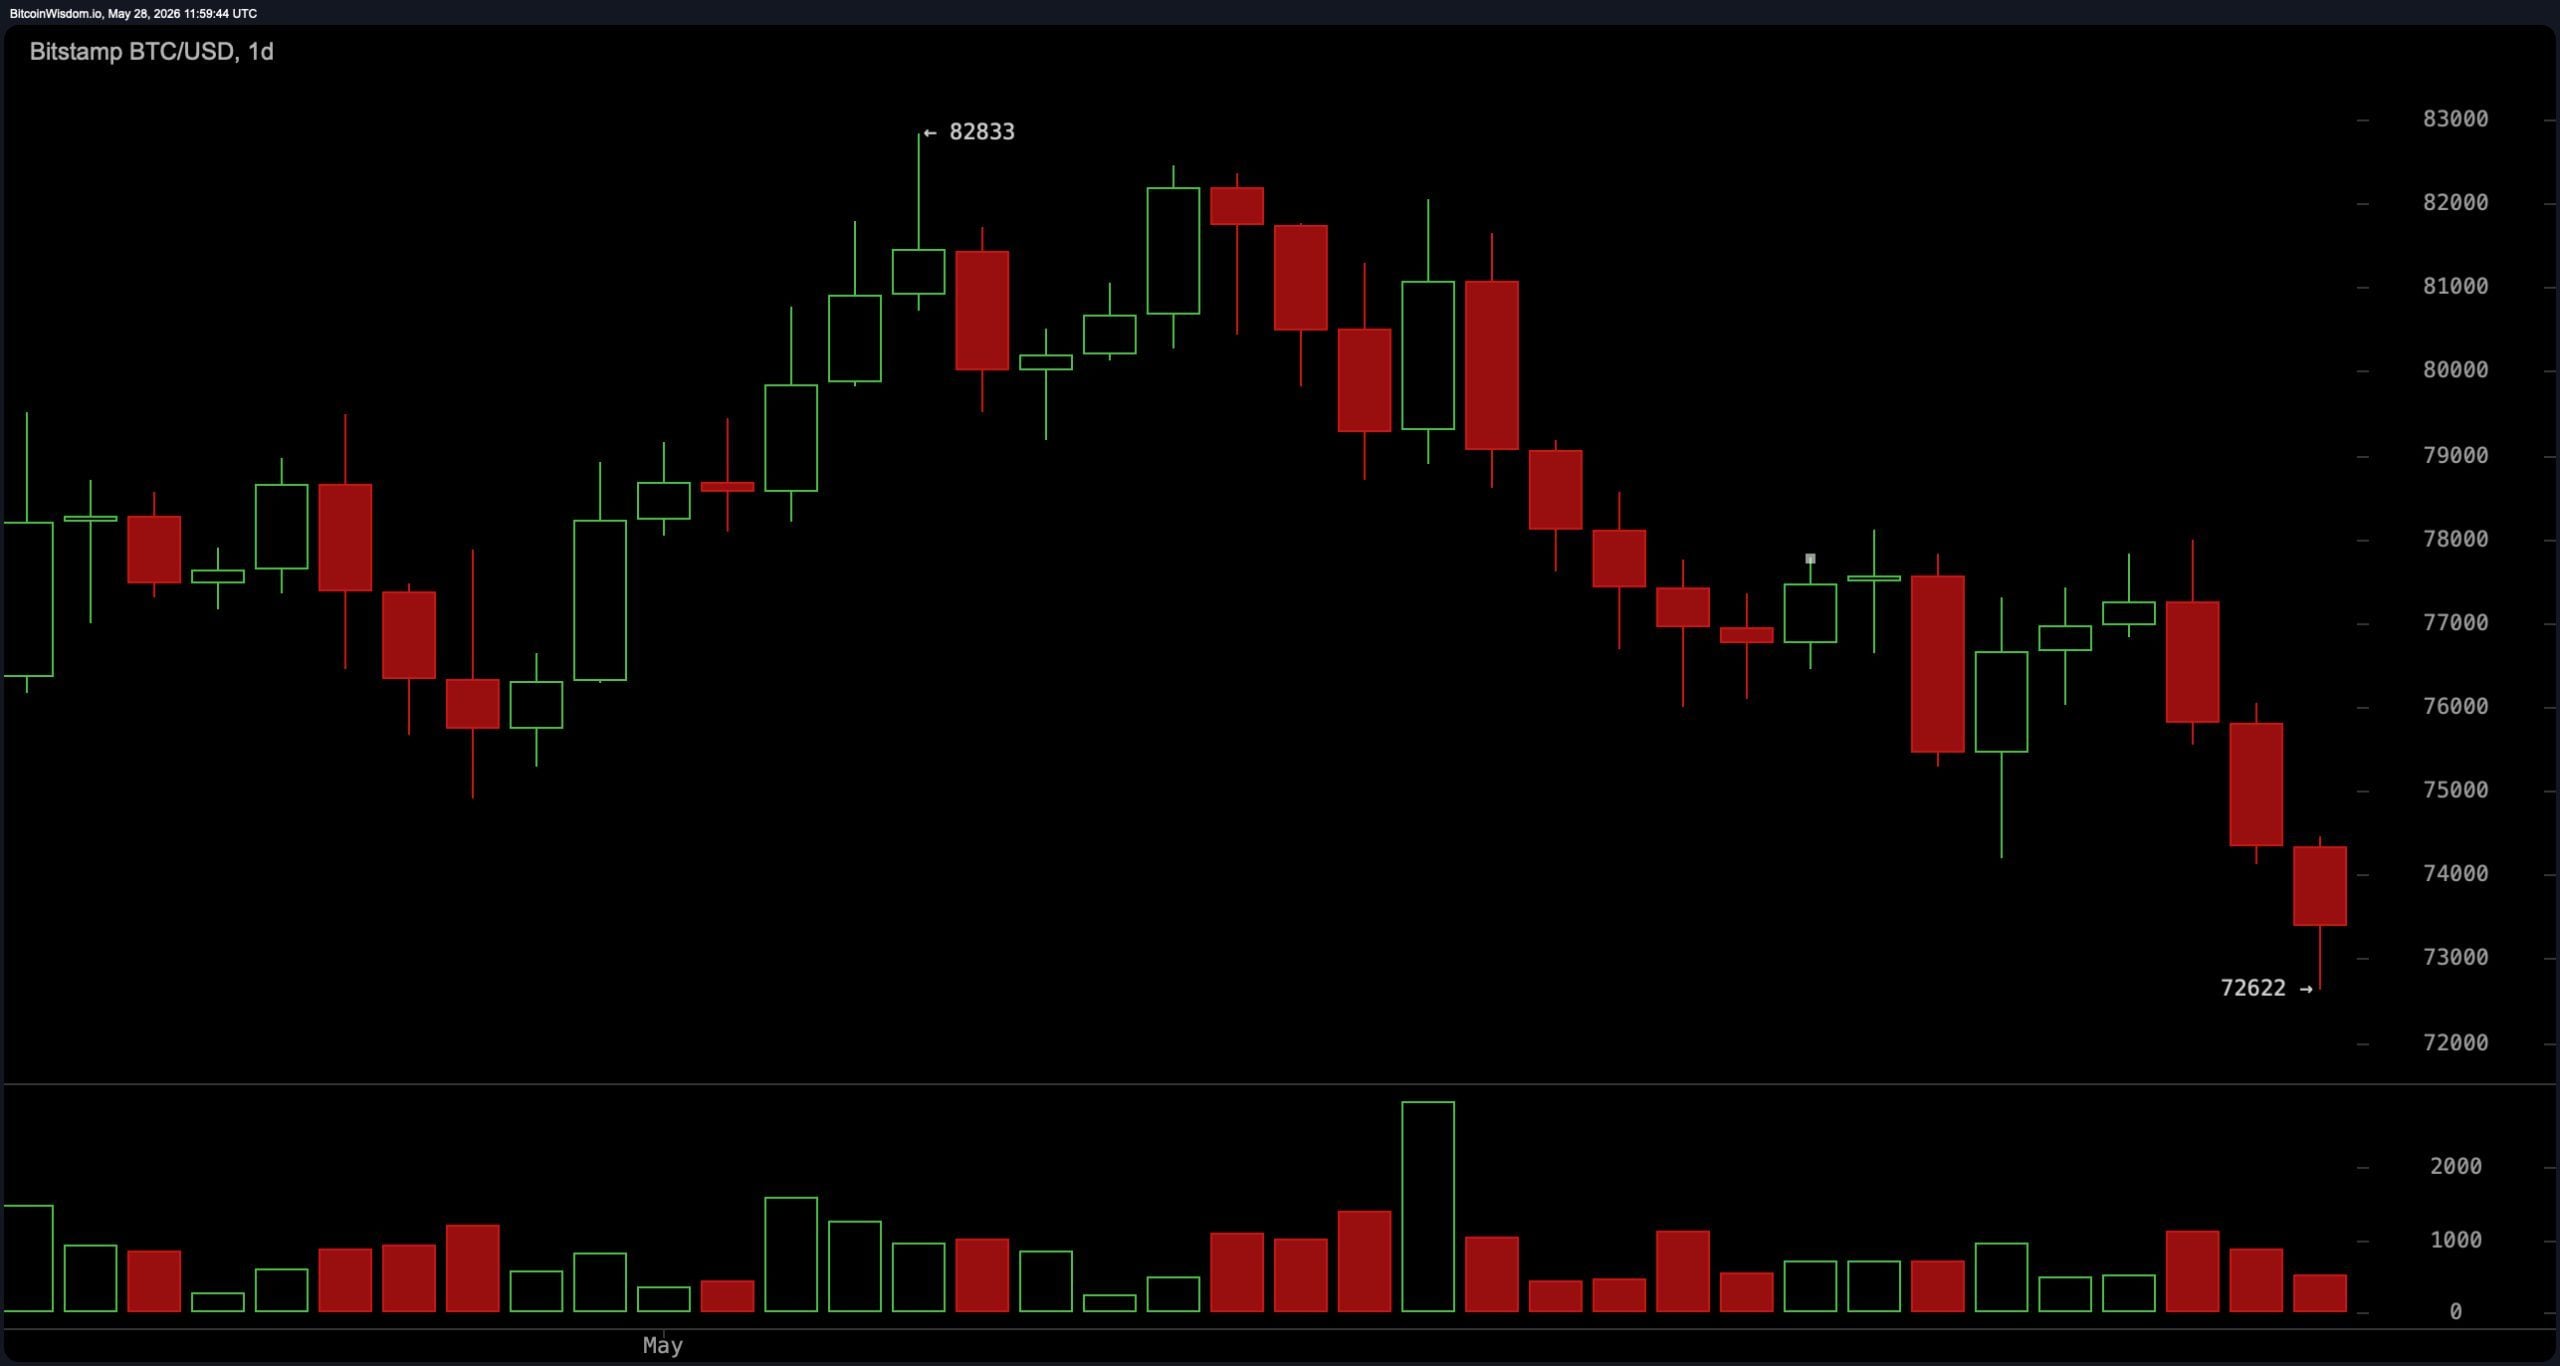
The daily chart told the most complete version of the recent breakdown. Bitcoin rejected near $82,800 and produced a series of consecutive lower highs, each accompanied by strong bearish candles that reflected meaningful participation from sellers at elevated prices. Daily momentum remained weak by every measure available, and the price had not reclaimed the $76,500-$78,000 area that traders identified as the threshold needed to neutralize the near-term bearish structure.
The 24-hour intraday range of $72,622 to $76,047 placed the price well below that recovery zone, and the daily chart offered little to suggest an imminent shift. Broader support levels at $71,800 and $70,000 remained on the radar as potential targets if the current $72,600 floor gave way under renewed pressure.
Oscillator readings on May 28 painted a predominantly neutral picture with pockets of concern. The relative strength index ( RSI) registered at 38, stopping short of oversold territory but reflecting sustained downward pressure. The stochastic printed at 20, the stochastic RSI fast sat at 17, and the Williams percent range reached -100, three readings that, taken together, suggested price was approaching technically stretched conditions on the short side.
The commodity channel index (CCI) registered -131, the Awesome oscillator came in at -2,051, and bull bear power printed -3,603, all reading neutral. Two indicators broke from that neutral consensus: Momentum registered at -3,253 as a bearish signal, and the moving average convergence divergence ( MACD) level printed -550, a direct confirmation that downward momentum remained embedded in the current structure. The ultimate oscillator at 40 and the average directional index (ADX) at 20 both held neutral, suggesting the trend lacked the acceleration needed to classify the move as a full breakdown.
The moving average (MA) picture leaned decisively toward caution. Of the 15 moving averages tracked, 13 out of 15 MAs registered bearish signals, one was neutral, and only one, the simple moving average (SMA-100) at $72,910, registered a constructive reading, placing that level as a key technical support zone worth monitoring. The exponential moving average (EMA-10) sat at $76,559, and the SMA-10 at $76,505, both above the current price and acting as near-term resistance.
Longer-duration averages reinforced that picture: the EMA-200 at $81,355 and the SMA-200 at $80,129 were well above price, confirming the broader trend remained under pressure. The cluster of exponential and simple moving averages stacked between $76,500 and $78,400 formed a dense resistance band that bitcoin would need to clear convincingly before the intermediate-term outlook shifted.
Until that happens, the moving average structure confirmed what price action had been communicating for days: the path of least resistance remained to the downside.



Credit: Source link