
 Price Finally Bottomed? Here’s Where It Could Head in June 2026")
The Ethereum price experienced its sharpest corrections in recent months, falling to around the $1,560 region after losing more than 22%. The decline has pushed ETH back into a major historical demand zone that previously acted as a launching pad for significant rallies. While the brutal sell-off has sparked speculation that the market may finally be bottoming out, the derivatives market tells a more nuanced story.
Funding rates have turned negative, Open Interest has witnessed a sharp decline, and momentum indicators continue to weaken. Together, these signals suggest that the market is undergoing a leverage flush rather than confirming the start of a fresh uptrend. As a result, the ETH price may be entering the final stages of capitulation, but the technical evidence needed to declare a bottom is still absent.
Ethereum Has Entered a Critical Support Zone
The weekly chart shows Ethereum trading directly above a long-term support region around the $1,500-$1,600 range. Historically, this area has attracted significant buying interest and prevented deeper corrections, making it one of the most important levels on the chart.
However, price alone does not confirm a reversal. The latest weekly candle reflects aggressive selling pressure, with bears pushing ETH sharply lower in a short period. Although the asset is now sitting at support, the overall market structure remains bearish.

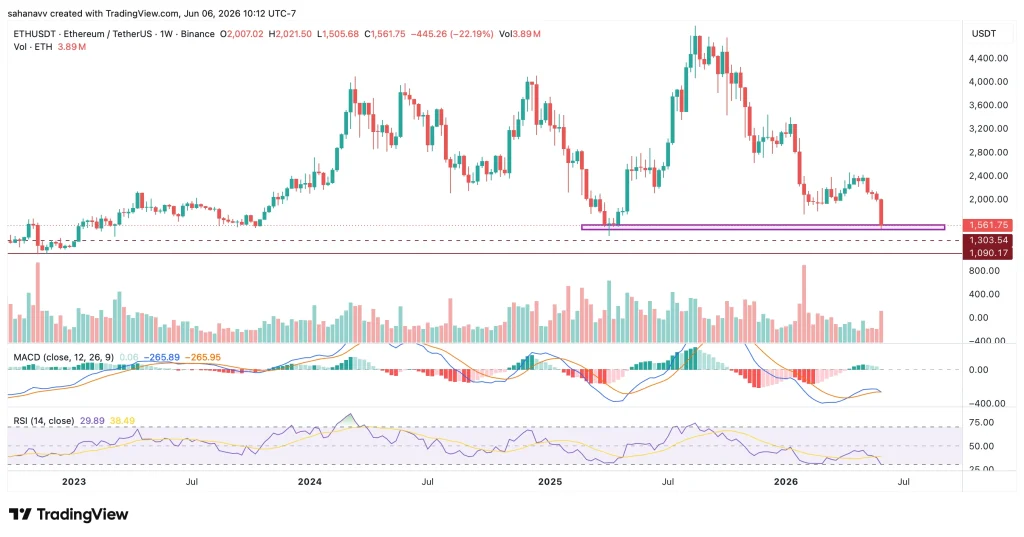
The RSI has dropped close to the oversold region, indicating that selling pressure may be becoming exhausted. At the same time, the MACD remains in bearish territory without showing a convincing bullish crossover, meaning downside momentum has yet to fully disappear.
Negative Funding Rates Reflect Growing Fear
Ethereum’s OI-weighted funding rate has recently slipped into negative territory, indicating that traders are increasingly positioning for additional downside. In perpetual futures markets, negative funding means short sellers are paying long holders, reflecting a bearish sentiment across leveraged traders.
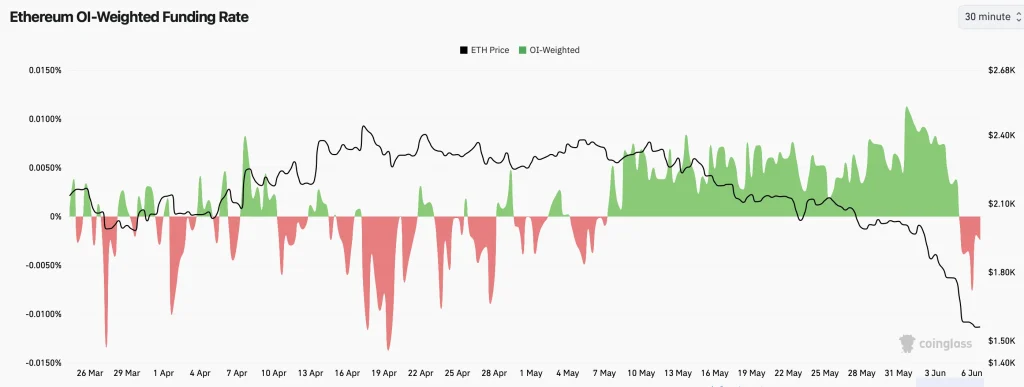
When a majority of participants become convinced that prices will continue falling, markets frequently move in the opposite direction as excessive bearish positioning unwinds. However, negative funding should not be interpreted as a direct buy signal. It merely highlights deteriorating sentiment rather than confirming a reversal.
Open Interest Points to Capitulation Rather Than Fresh Selling
Perhaps the strongest signal comes from Ethereum’s Open Interest. The latest data shows a sharp decline in Open Interest alongside the fall in price. This combination typically indicates that leveraged positions are being liquidated or voluntarily closed rather than new bearish bets entering the market.
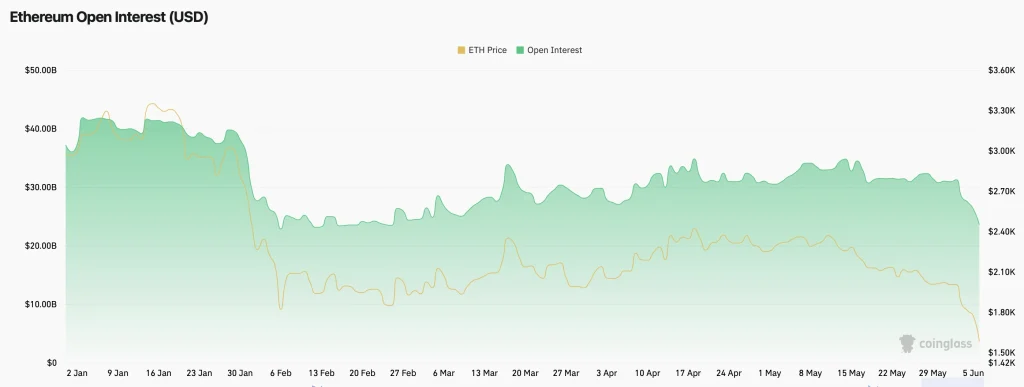
Ethereum is witnessing falling prices accompanied by falling Open Interest, suggesting that leverage is leaving the system. This type of market behavior is commonly associated with capitulation events, where excessive speculation gets flushed out before a more sustainable trend eventually develops.
Ethereum (ETH) Price Prediction for June 2026
Based on the current technical structure and derivatives data, the Ethereum price appears to be entering a capitulation phase rather than a confirmed reversal. The combination of negative funding rates and declining Open Interest suggests leverage is being flushed from the market, a process that often lays the foundation for future recoveries.
However, the chart still lacks the technical confirmation needed to declare that the bottom is in. Until momentum indicators improve and buyers reclaim key resistance levels, the recent weakness should be viewed as part of a bottoming process rather than the beginning of a new bullish trend.
The coming weeks are likely to determine whether Ethereum transforms this major support zone into a launchpad for recovery or whether another leg lower remains ahead.
Was this writing helpful?
Story Ends Here
Trust with CoinPedia:
CoinPedia has been delivering accurate and timely cryptocurrency and blockchain updates since 2017. All content is created by our expert panel of analysts and journalists, following strict Editorial Guidelines based on E-E-A-T (Experience, Expertise, Authoritativeness, Trustworthiness). Every article is fact-checked against reputable sources to ensure accuracy, transparency, and reliability. Our review policy guarantees unbiased evaluations when recommending exchanges, platforms, or tools. We strive to provide timely updates about everything crypto & blockchain, right from startups to industry majors.
Investment Disclaimer:
All opinions and insights shared represent the author’s own views on current market conditions. Please do your own research before making investment decisions. Neither the writer nor the publication assumes responsibility for your financial choices.
Sponsored and Advertisements:
Sponsored content and affiliate links may appear on our site. Advertisements are marked clearly, and our editorial content remains entirely independent from our ad partners.
Read the Next News
Credit: Source link


