Close Menu
CatchTheBullCatchTheBull
  • Home
  • Crypto News
  • Bitcoin
  • Altcoin
  • Blockchain
  • Airdrops News
  • NFT News
What's Hot

Chainlink Emerges as RWA Leader Across Multiple Sector Rankings

May 15, 2026

Ethereum Dips To $2,250 As Trader Profit-Taking Hits 3-Week High

May 15, 2026

Belgium Online Gambling Nearly Doubled to 14.8% Since 2018 Despite EU-Toughest Ad Ban

May 15, 2026
Facebook X (Twitter) Instagram
CatchTheBullCatchTheBull
  • Home
  • Crypto News
  • Bitcoin
  • Altcoin
  • Blockchain
  • Airdrops News
  • NFT News
CatchTheBullCatchTheBull
Bitcoin

Bitcoin Holding Above Gaussian Channel, Bull Market Structure Still Intact

By WebDeskOctober 20, 20253 Mins Read
Bitcoin Holding Above Gaussian Channel, Bull Market Structure Still Intact
Share
Facebook Twitter LinkedIn Pinterest Email

Bitcoin is trading around $107,000 after its recent flash crash, maintaining stability to prevent further decline but is yet to return to trading above $110,000. Notably, popular crypto analyst Titan of Crypto shared a detailed Gaussian Channel analysis on X that points to Bitcoin’s macro bull structure remaining intact despite short-term volatility. His post, which was accompanied by a Bitcoin price chart, shows how Bitcoin’s position relative to the Gaussian Channel offers a clear view of the ongoing cycle.

Related Reading

Bull Market Intact Above Gaussian Channel

Titan of Crypto noted that Bitcoin’s placement above the Gaussian Channel represents strength in the long-term trend. As shown in the weekly candlestick price chart below, the green channel corresponds to bullish phases, while red regions represent bearish downturns, a prime example being the 2022 bear market. 

At the time of writing, the upper band is positioned around $101,300 and trending upward. Therefore, Bitcoin’s price action around $107,000 means that it is yet to break into the Gaussian channel and its overall market structure is still solid. From this, it can be inferred that Bitcoin’s current pullback from the October 6 all-time high above $126,000 is only a temporary pause within a larger bull market.

Bitcoin Gaussian Channel. Source: Titan of Crypto on X

However, although the Gaussian Channel reading looks favorable, Titan of Crypto noted that the indicator should not be treated as a trading trigger. “It’s not a buy signal, it’s a macro context indicator,” he stated. Being above the Gaussian Channel doesn’t necessarily equate to buying more. It simply means the bull market structure is still intact. 

The Gaussian Channel works best when combined with other indicators such as trading volume, moving averages, and on-chain accumulation trends to confirm directional momentum.

BTCUSD currently trading at $108,099. Chart: TradingView

Coinbase Premium Gap Turns Red

Speaking of other indicators, on-chain data from CryptoQuant shows that the Coinbase Premium Gap, a metric comparing Bitcoin’s price on Coinbase versus other exchanges, has turned red. As shown in the chart below, Coinbase’s Premium Gap went on a sharp decline from positive premium levels above +60 earlier in the week to as low as -40 when the Bitcoin price fell to $101,000.

Bitcoin: Coinbase Premium Gap

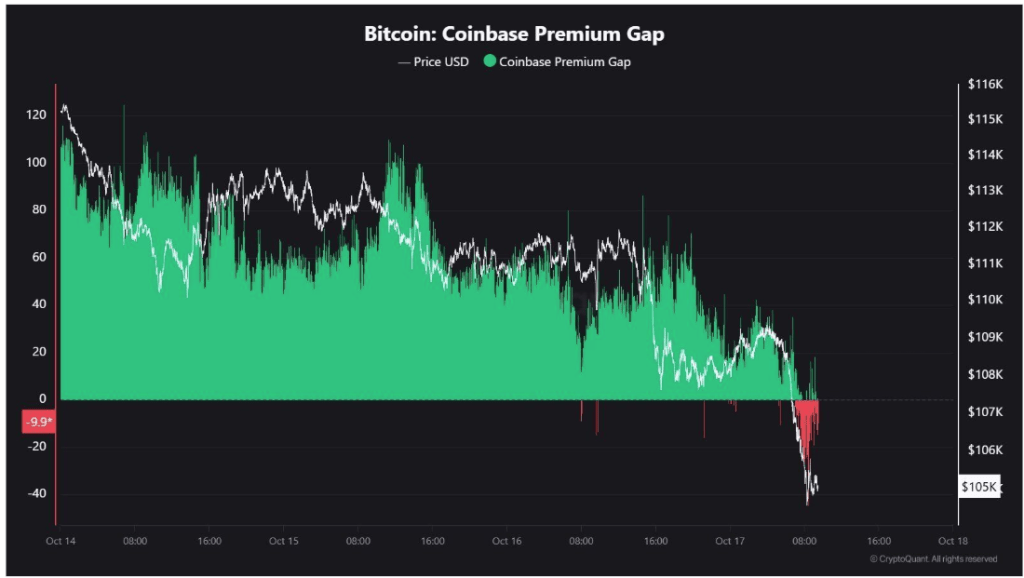
Interestingly, the Coinbase Premium Gap has increased to around -10 at the time of writing, meaning US investors are starting to turn bullish again. This can be seen as a bullish signal, as similar dips in US demand were recorded between March and April before the Bitcoin price eventually rallied more than 60% to reach new all-time highs.

Related Reading

However, a red Coinbase Premium Gap alone is not decisive. It should be interpreted alongside other data points, including ETF inflows, trading volume, liquidity, and derivatives funding rates. At the time of writing, Bitcoin was trading at $107,120.

Featured image from Vecteezy, chart from TradingView

Credit: Source link

Previous Article$4 Billion Buried in Brass, Silver and Gold: The Unclaimed Casascius Coins Still Guarding Over 38,000 BTC
Next Article Can SOL 2x From $200 While Digitap ($TAP) Targets 50x in 2025?

Related Posts

Ethereum Dips To $2,250 As Trader Profit-Taking Hits 3-Week High

May 15, 2026

Belgium Online Gambling Nearly Doubled to 14.8% Since 2018 Despite EU-Toughest Ad Ban

May 15, 2026

SIREN price crashes 51% as MACD signals deeper slide

May 15, 2026
Add A Comment
Leave A Reply Cancel Reply

Top Posts

Chainlink Emerges as RWA Leader Across Multiple Sector Rankings

May 15, 2026

Ethereum Dips To $2,250 As Trader Profit-Taking Hits 3-Week High

May 15, 2026

Belgium Online Gambling Nearly Doubled to 14.8% Since 2018 Despite EU-Toughest Ad Ban

May 15, 2026

Subscribe to Updates

Get the latest Crypto, Blockchain and Airdrop News from us to Catch The Bull.

Advertisement Banner

Welcome to CatchTheBull, your trusted source for the latest Crypto News and Airdrops. We bring you real-time updates, expert insights, and opportunities to stay ahead in the crypto world. Discover trending projects, market analyses, and airdrop details all in one place.

Join us on this journey to navigate the ever-evolving blockchain universe!

Facebook X (Twitter) Instagram YouTube
Top Insights

Why Bitcoin Still Needs Massive Capital Inflows To Ignite True Bull Run

Bitcoin Bulls Trigger $145M Short Squeeze as CLARITY Act Momentum Revives Risk Appetite

YouTube Unveils AI-Driven Tools to Boost Ads, Creator Partnerships

Get Informed

Subscribe to Updates

Get the latest Crypto, Blockchain and Airdrop News from us to Catch The Bull.

© 2026 CatchTheBull. All Rights Are Reserved.
  • Contact Us
  • Privacy Policy
  • Terms of Use
  • DMCA

Type above and press Enter to search. Press Esc to cancel.

  • bitcoinBitcoin(BTC)$80,369.001.02%
  • ethereumEthereum(ETH)$2,253.04-0.12%
  • tetherTether(USDT)$1.000.02%
  • binancecoinBNB(BNB)$682.251.84%
  • rippleXRP(XRP)$1.462.41%
  • usd-coinUSDC(USDC)$1.000.00%
  • solanaSolana(SOL)$91.000.37%
  • tronTRON(TRX)$0.351836-0.29%
  • Figure HelocFigure Heloc(FIGR_HELOC)$1.03-0.06%
  • dogecoinDogecoin(DOGE)$0.1143401.15%
  • whitebitWhiteBIT Coin(WBT)$58.990.78%
  • USDSUSDS(USDS)$1.000.01%
  • HyperliquidHyperliquid(HYPE)$45.2916.02%
  • cardanoCardano(ADA)$0.2662940.82%
  • leo-tokenLEO Token(LEO)$10.311.67%
  • zcashZcash(ZEC)$533.932.30%
  • bitcoin-cashBitcoin Cash(BCH)$430.62-0.63%
  • chainlinkChainlink(LINK)$10.270.69%
  • moneroMonero(XMR)$393.25-0.65%
  • CantonCanton(CC)$0.1612221.13%
  • the-open-networkToncoin(TON)$2.08-0.65%
  • stellarStellar(XLM)$0.1584730.01%
  • suiSui(SUI)$1.13-5.20%
  • litecoinLitecoin(LTC)$58.102.09%
  • USD1USD1(USD1)$1.000.03%
  • daiDai(DAI)$1.000.01%
  • Ethena USDeEthena USDe(USDE)$1.000.02%
  • MemeCoreMemeCore(M)$3.24-3.41%
  • avalanche-2Avalanche(AVAX)$9.740.87%
  • hedera-hashgraphHedera(HBAR)$0.0934660.99%
  • shiba-inuShiba Inu(SHIB)$0.000006-0.03%
  • RainRain(RAIN)$0.007457-0.96%
  • paypal-usdPayPal USD(PYUSD)$1.000.00%
  • Global DollarGlobal Dollar(USDG)$1.000.01%
  • crypto-com-chainCronos(CRO)$0.0748801.60%
  • Circle USYCCircle USYC(USYC)$1.120.00%
  • BittensorBittensor(TAO)$298.841.28%
  • tether-goldTether Gold(XAUT)$4,543.67-3.12%
  • BlackRock USD Institutional Digital Liquidity FundBlackRock USD Institutional Digital Liquidity Fund(BUIDL)$1.000.00%
  • uniswapUniswap(UNI)$3.672.56%
  • mantleMantle(MNT)$0.680.54%
  • polkadotPolkadot(DOT)$1.330.59%
  • World Liberty FinancialWorld Liberty Financial(WLFI)$0.067153-0.58%
  • pax-goldPAX Gold(PAXG)$4,541.29-3.14%
  • nearNEAR Protocol(NEAR)$1.54-1.04%
  • Ondo US Dollar YieldOndo US Dollar Yield(USDY)$1.13-0.35%
  • OndoOndo(ONDO)$0.376616-1.30%
  • okbOKB(OKB)$86.532.32%
  • Falcon USDFalcon USD(USDF)$1.000.03%
  • Pi NetworkPi Network(PI)$0.1693350.00%