

If you’re serious about trading, learning candlestick patterns is a must. These tiny chart shapes hold powerful clues. They show what buyers and sellers are doing in real time. Some patterns suggest reversals. Others point to strong momentum. The key is knowing which ones matter the most.
Let’s walk through the most important candlestick patterns you should know. We’ll keep it simple and clear. Whether you’re trading crypto, stocks, or forex—these patterns can help you spot better entries and exits.
This is part 14 of a series of trading guides
Why Candlestick Patterns Matter
Candlestick patterns show how price moves during a specific time frame. They combine opening, closing, high, and low prices into one visual bar. When grouped together, these bars tell a story.
Sometimes the story says, “Trend is over, prepare for a reversal.” Other times it says, “Momentum is strong, stay in the trade.”
So, what are the top candlestick patterns to watch?
Bullish Candlestick Patterns
These patterns usually form after a downtrend. They suggest that buyers may be taking over from sellers.
Bullish Engulfing
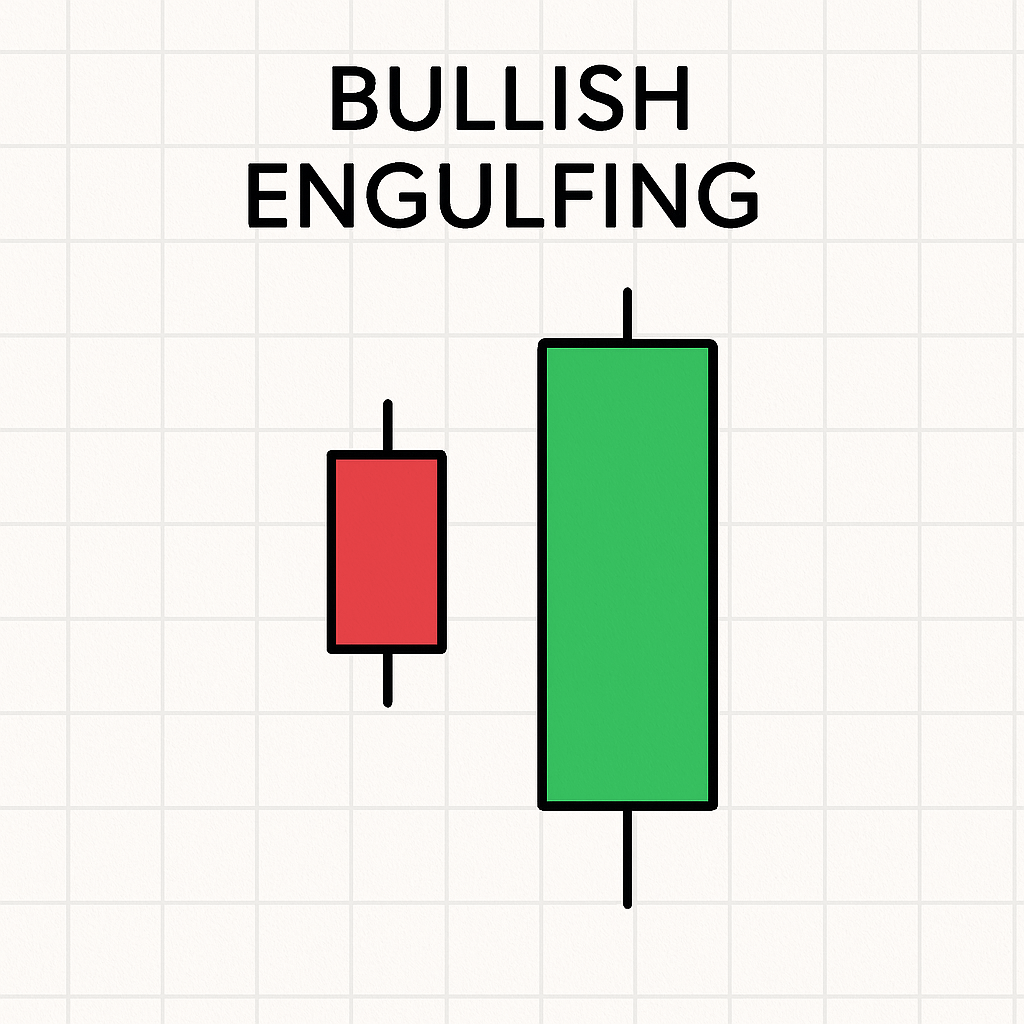
This happens when a small red candle is followed by a larger green candle. The green one completely “engulfs” the red one.
It shows strong buyer momentum. It’s more powerful when seen at a support level or after a dip.
Hammer
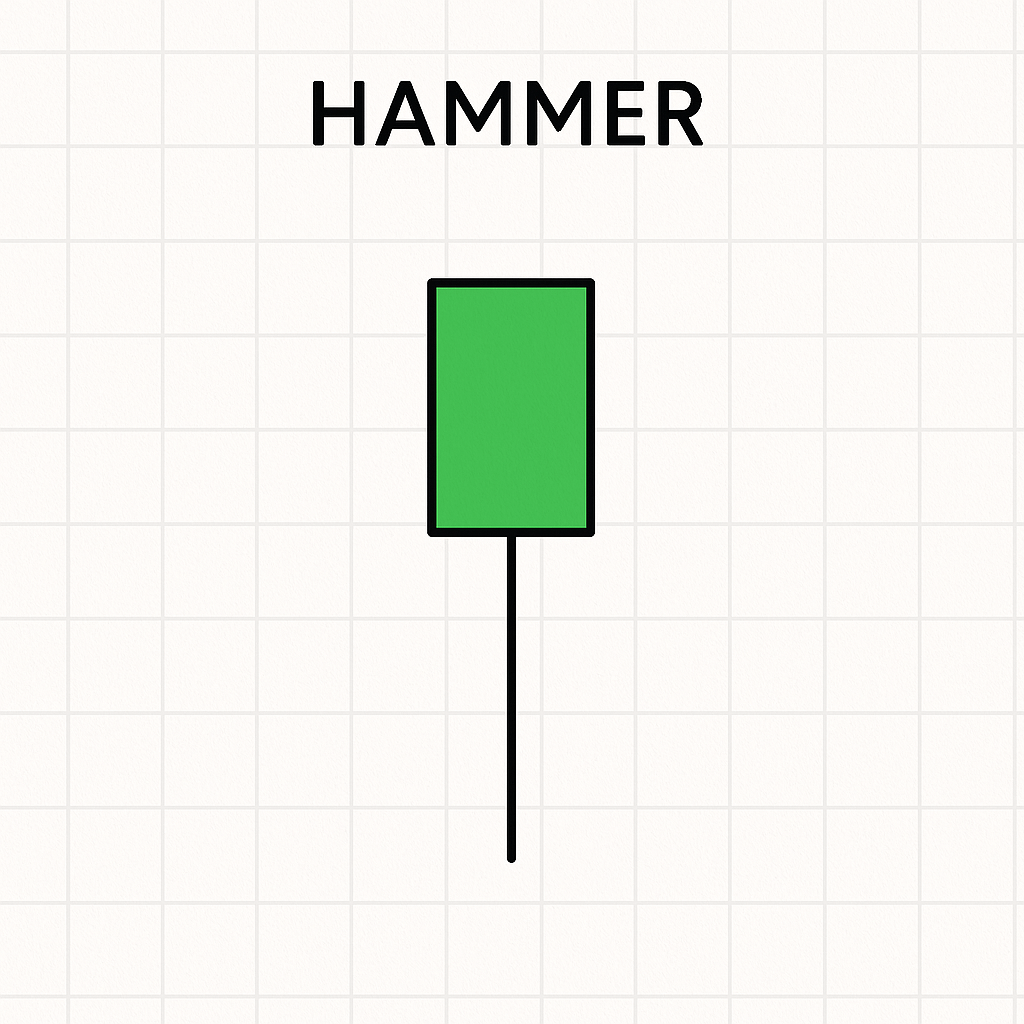
The hammer has a small body and a long lower wick. It shows that sellers tried to push the price down, but buyers stepped in.
It often appears after a downtrend and suggests a possible bounce.
Dragonfly Doji
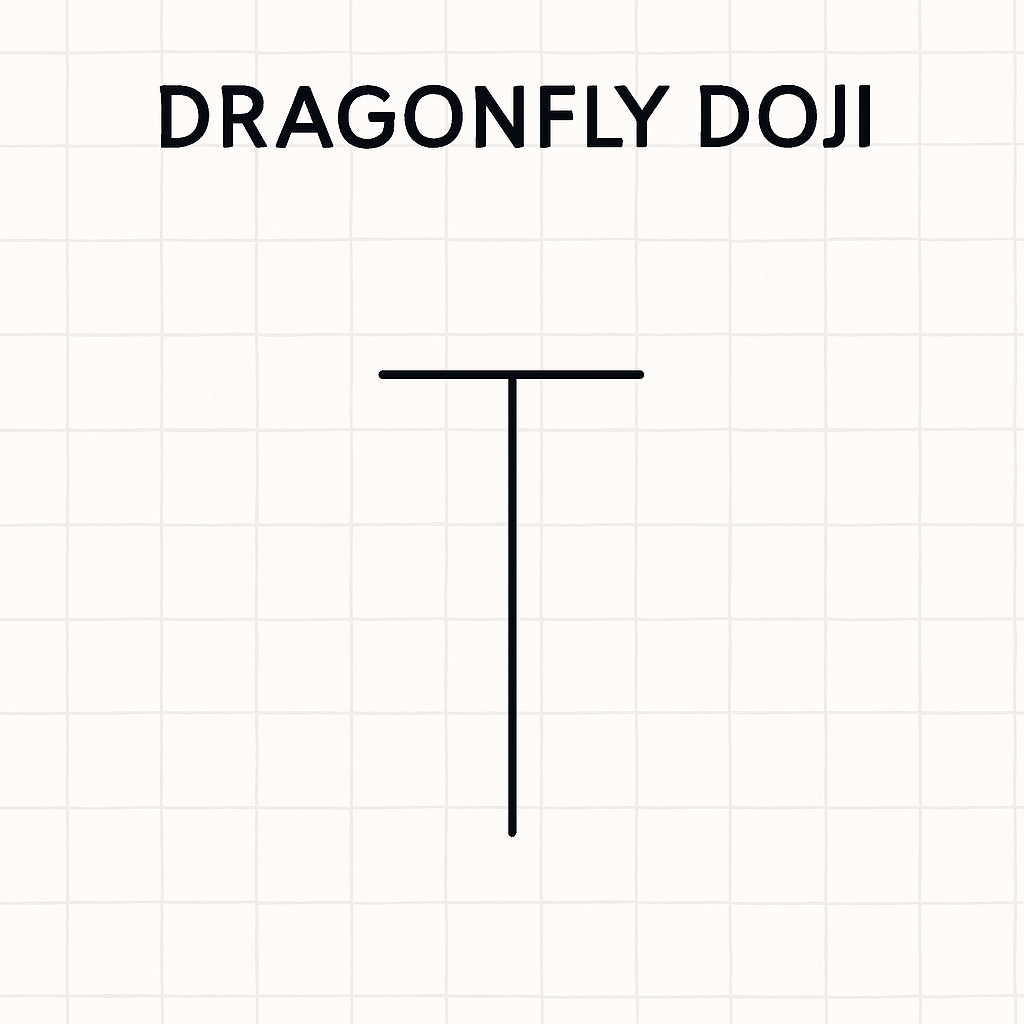
This pattern looks like a “T”. It has a flat top and a long lower wick. The open, close, and high are nearly the same.
It shows strong buying pressure, often after a period of selling.
Morning Star
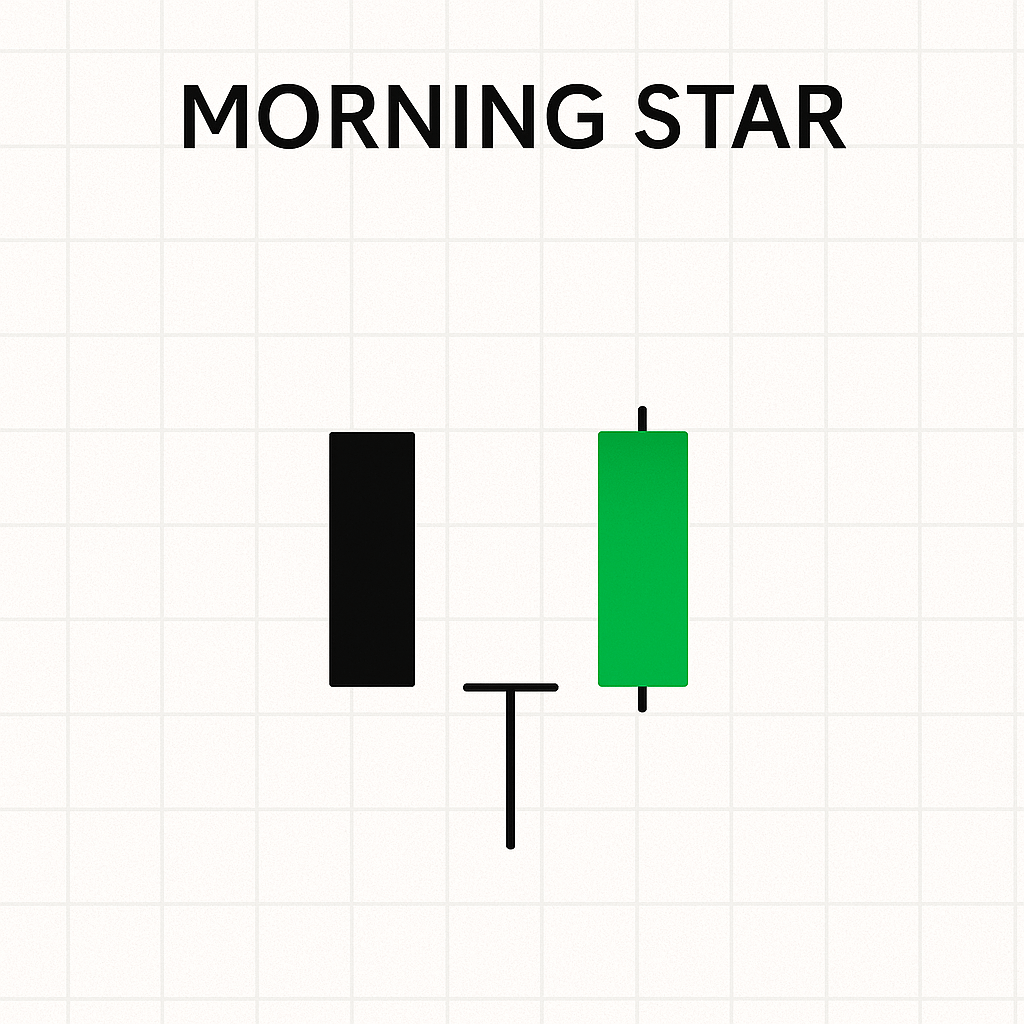
The morning star has three candles. First, a red one. Second, a small indecision candle (like a doji). Third, a large green candle.
Together, they suggest the trend may reverse upward.
Three White Soldiers
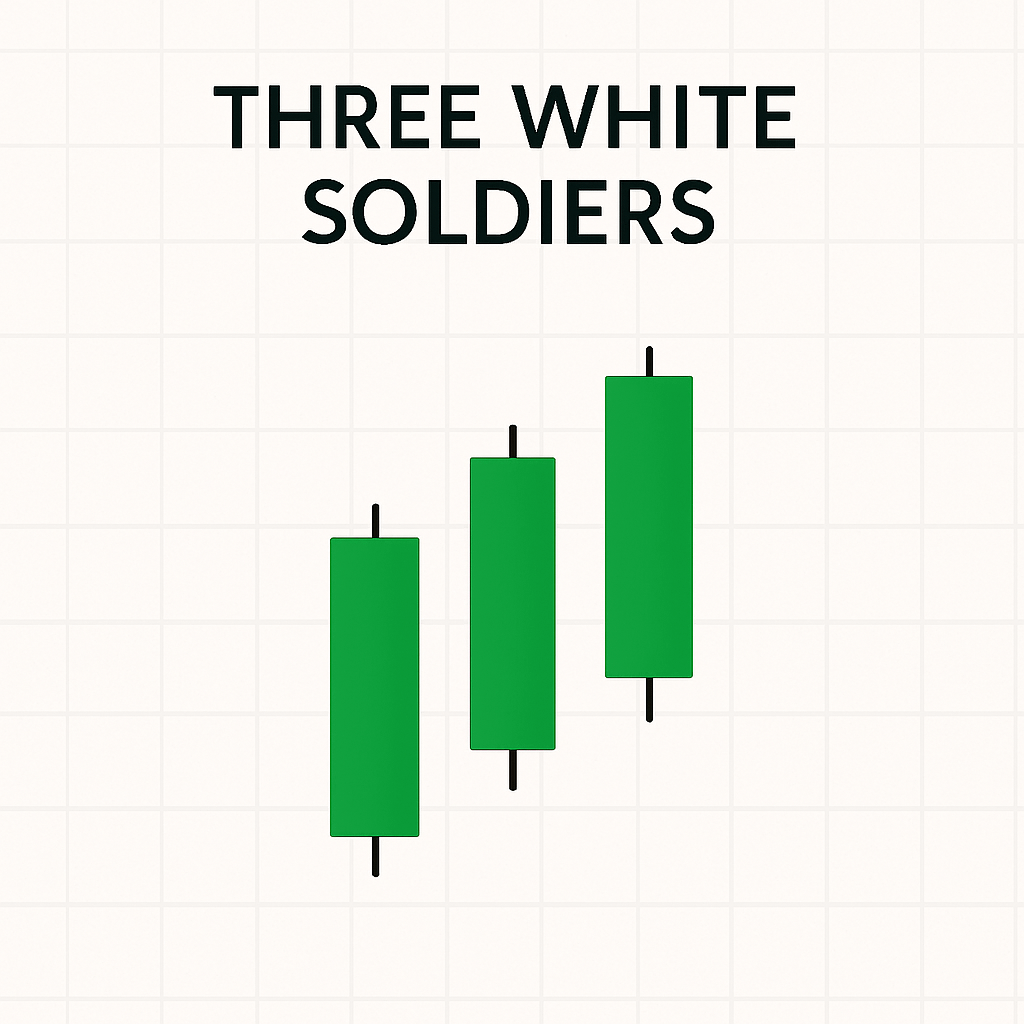
These are three strong green candles in a row. Each one closes higher than the last.
They show strong buyer interest and often confirm a bullish reversal or breakout.

Bearish Candlestick Patterns
These patterns form after a rally or during an uptrend. They suggest that sellers might take control.
Bearish Engulfing
A large red candle swallows a smaller green one before it. This signals a potential reversal.
It’s more effective near resistance or after a long green streak.
Shooting Star
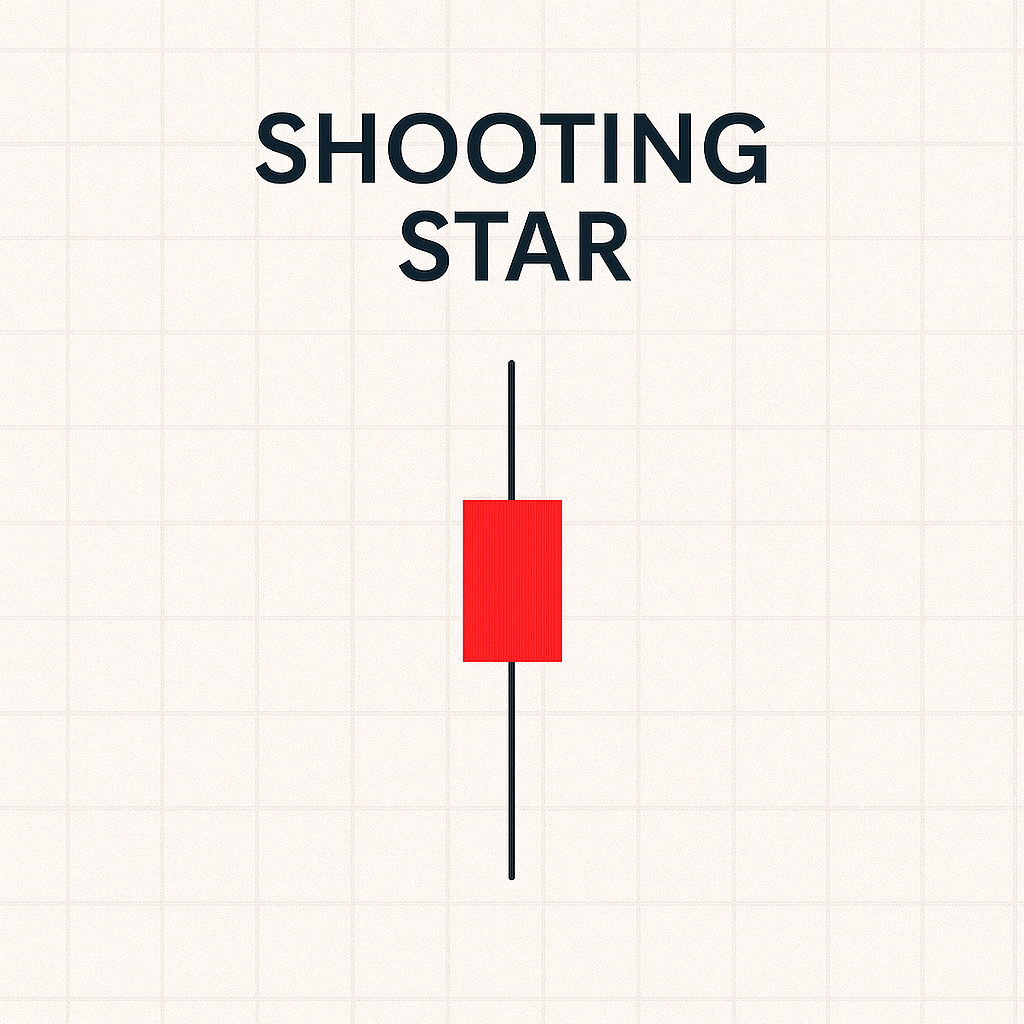
This candle has a small body and a long upper wick. It means price went up but couldn’t stay there.
Buyers were active, but sellers won the day.
Gravestone Doji
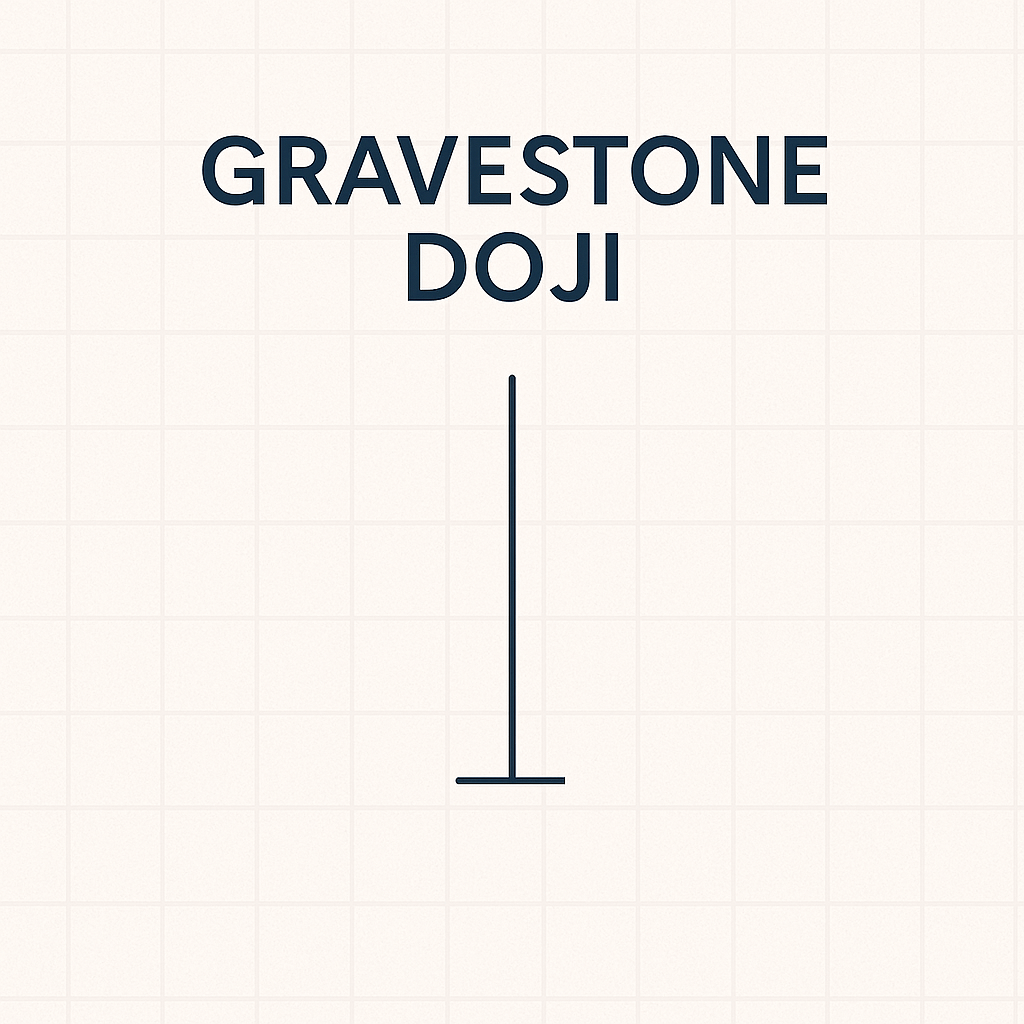
This doji has a flat base and a long upper shadow. It looks like an upside-down “T”.
It signals rejection at higher levels and a possible shift downward.
Evening Star
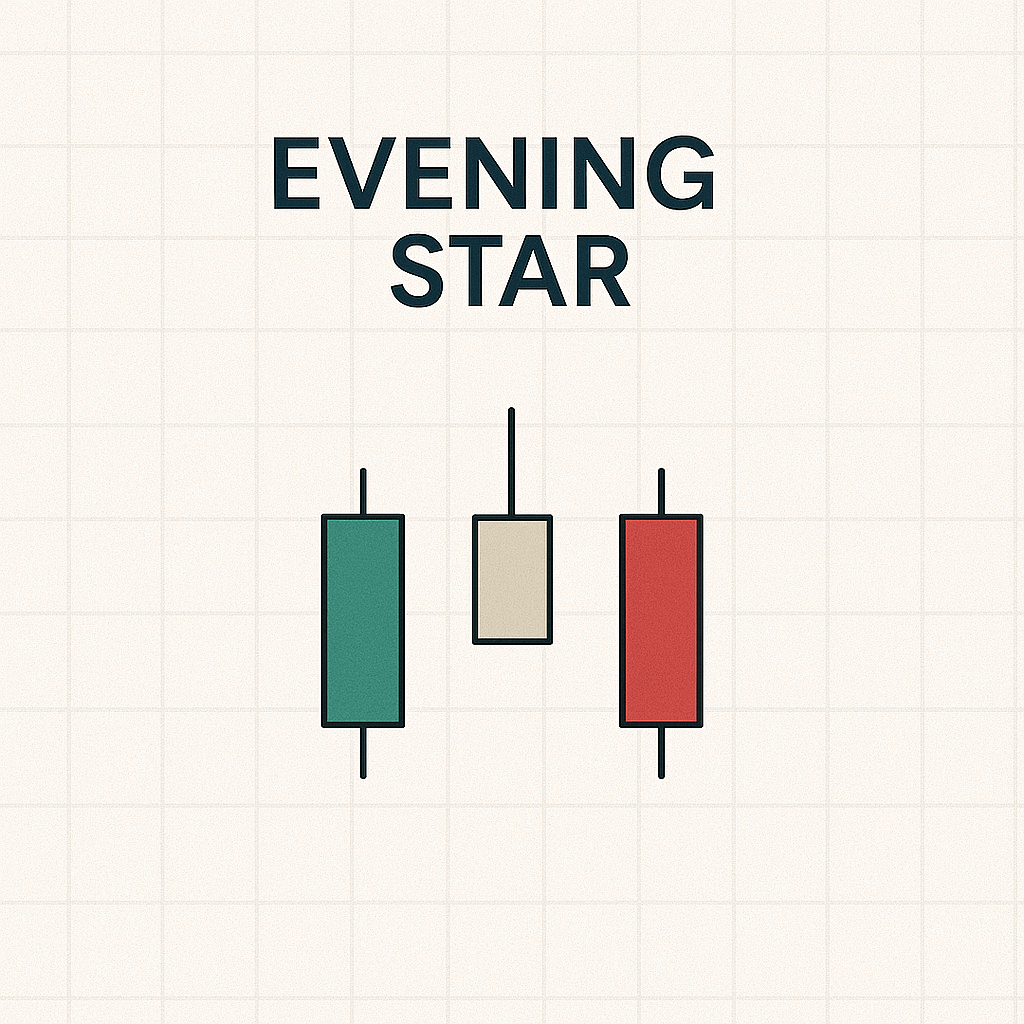
This pattern includes a strong green candle, a small indecision candle, and a big red candle.
It suggests the end of an uptrend and a potential reversal to the downside.
Three Black Crows
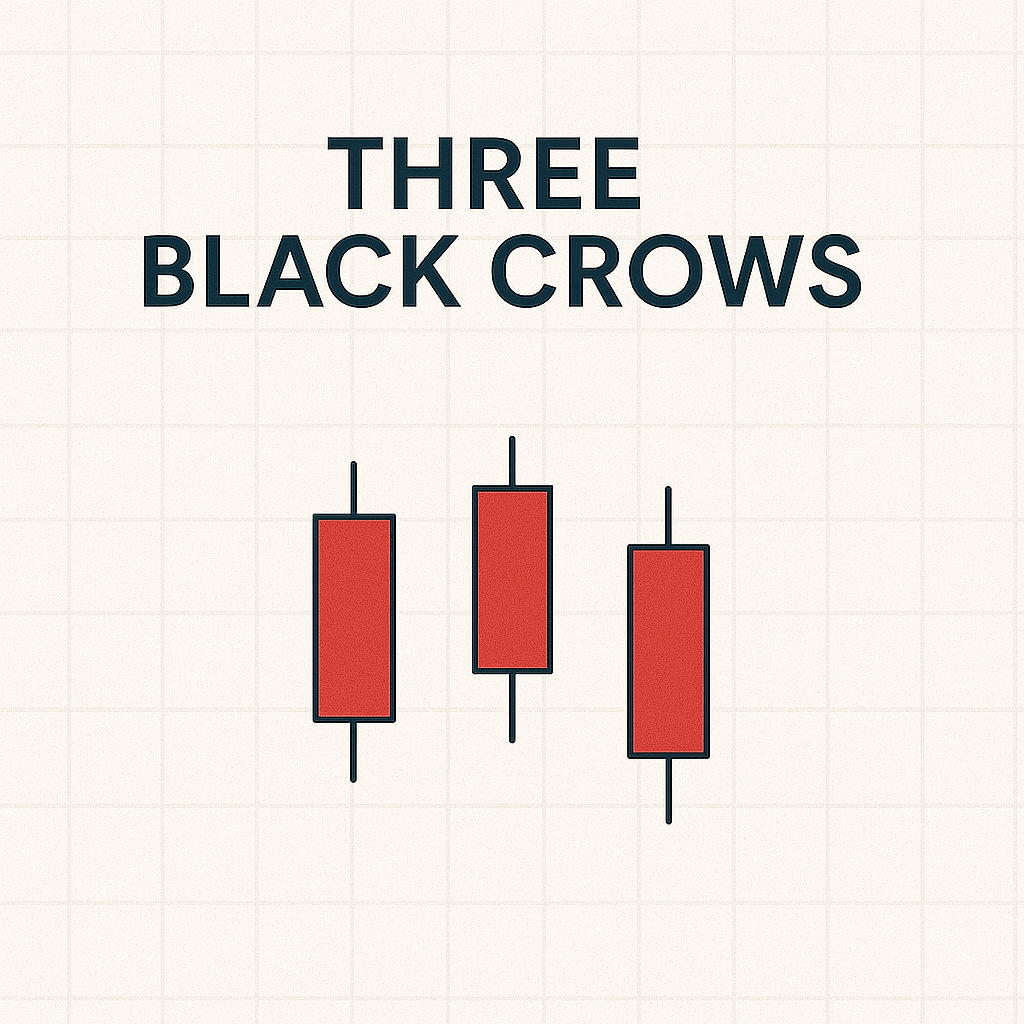
These are three red candles in a row. Each one closes lower than the last.
They signal strong selling pressure and can appear after a price peak.

Neutral and Indecision Candles
These candles don’t confirm a clear direction. But they often appear before major moves.
Doji
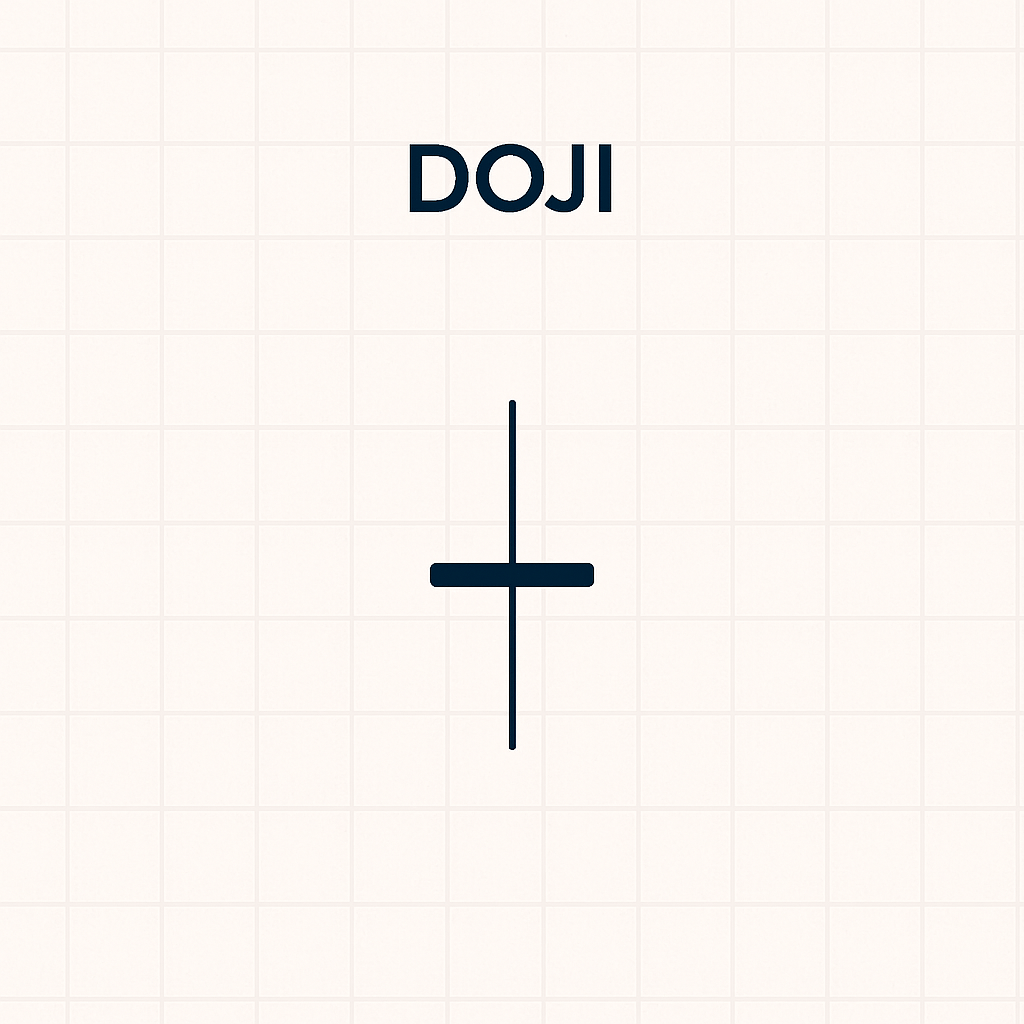
This candle has almost the same open and close price. It shows that buyers and sellers are balanced.
On its own, it’s neutral. But near key levels, it can hint at a coming shift.
Spinning Top
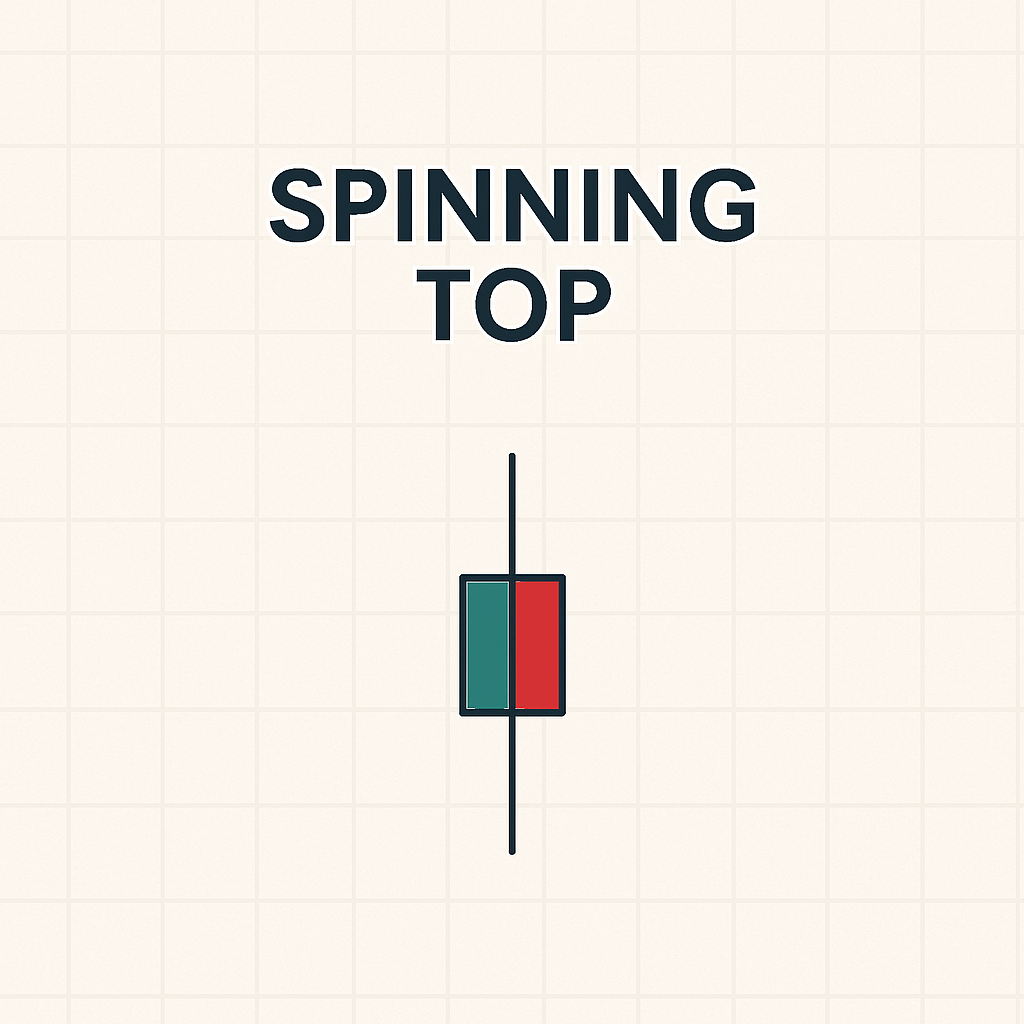
This candle has a small body and equal upper and lower wicks. It shows indecision in the market.
Traders often wait for the next candle to confirm the move.
Inside Bar
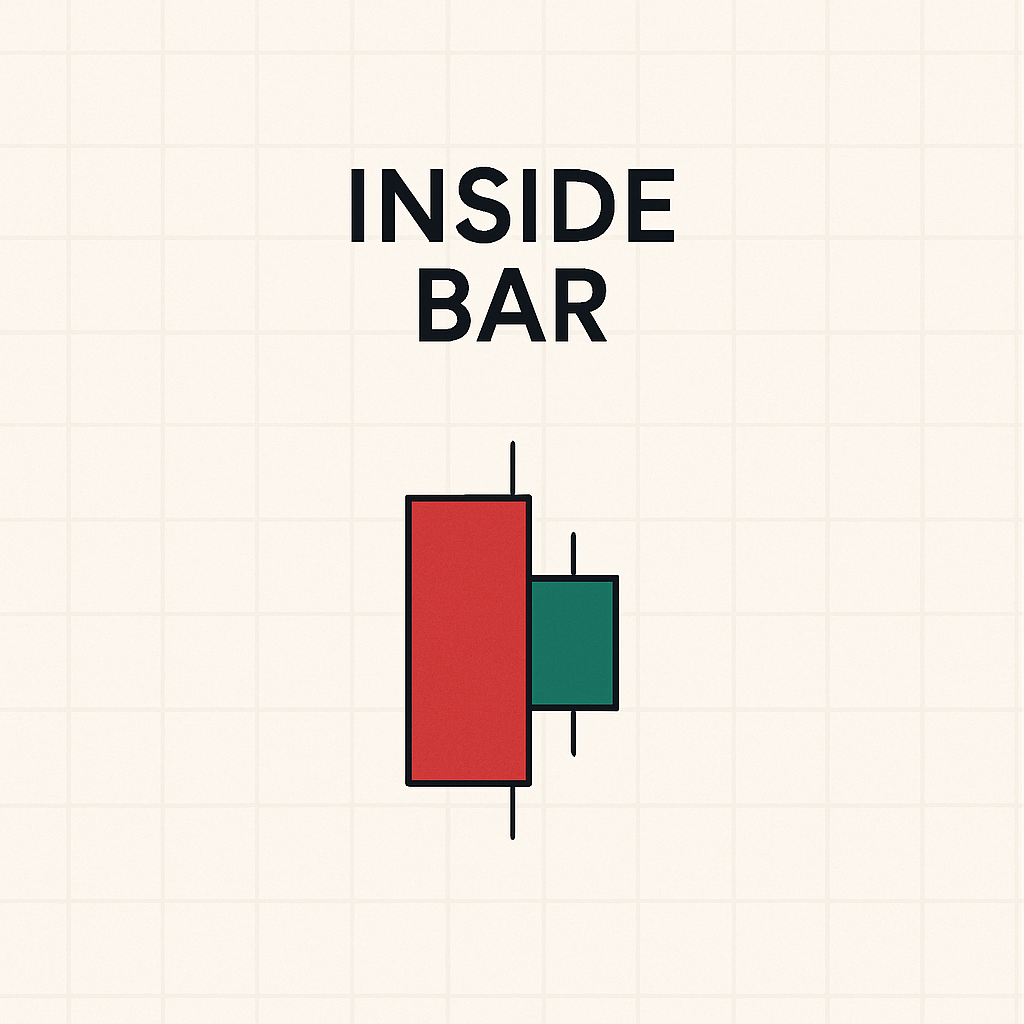
This pattern forms when a candle fits entirely inside the range of the one before it.
It shows price consolidation. The breakout from this range often brings strong momentum.
How to Use Candlestick Patterns in Real Trading
Knowing candlestick patterns is just the first step. Using them well takes practice. Here are a few tips:
- Look at the trend. Patterns work best with context.
- Use volume. It adds confirmation.
- Combine with indicators. RSI, MACD, and moving averages help.
- Don’t trade every pattern. Focus on clear setups.
These patterns aren’t magic. But they give you clues about what the market might do next.
Support Our Work
If you enjoy insights like these, consider using our referral links when signing up for exchanges. It helps us continue offering free content.
Try BloFin for a fast, non-KYC exchange or Bybit, our go-to trading platform. Every referral makes a difference. Thanks for the support!
Always trade with proper risk management. Don’t bet it all and use a stop loss! This is a long game, not a get-rich-quick scheme.
Final Thoughts
Candlestick patterns are one of the easiest ways to read the market. They’re quick, visual, and full of useful hints.
Now that you know the most important ones, try spotting them on real charts. With time, you’ll notice them more and use them better.
Next up, I’ll create clear visual illustrations of each pattern so you can add them to your blog.
Would you like a single infographic of all the patterns too? Or separate images for each one?
If you enjoyed this blog, check out the new trend of tokenized stocks, and put your new candlestick knowledge to use!
As always, don’t forget to claim your bonus below on Bybit. See you next time!
Credit: Source link


