

In trading, success isn’t just about signals. It’s about learning tools that sharpen your edge. While we share market insights and trade ideas, we also believe in helping you grow your own trading skills. Today, let’s explore one of the most popular indicators out there: Bollinger Bands.
This is part 13 of a series of trading guides
What Are Bollinger Bands?
Bollinger Bands are a charting tool used to measure market volatility. They were created in the 1980s by John Bollinger. These bands form a price envelope, meaning they define upper and lower boundaries around a moving average. The bands automatically widen or tighten based on how volatile the market is.
The setup includes:
- A simple moving average (SMA) in the middle
- An upper band, which is the SMA plus two standard deviations
- A lower band, which is the SMA minus two standard deviations
This setup helps traders visualize if prices are high or low relative to recent history.
Meet John Bollinger
John Bollinger is a technical analyst who wanted to create a more adaptive way to assess price trends. With a background in mathematics and engineering, he blended statistical tools with market analysis. The result was a dynamic indicator that responds to changing volatility. He also founded Bollinger Capital Management and remains a respected voice in financial circles.
How Bollinger Bands Work
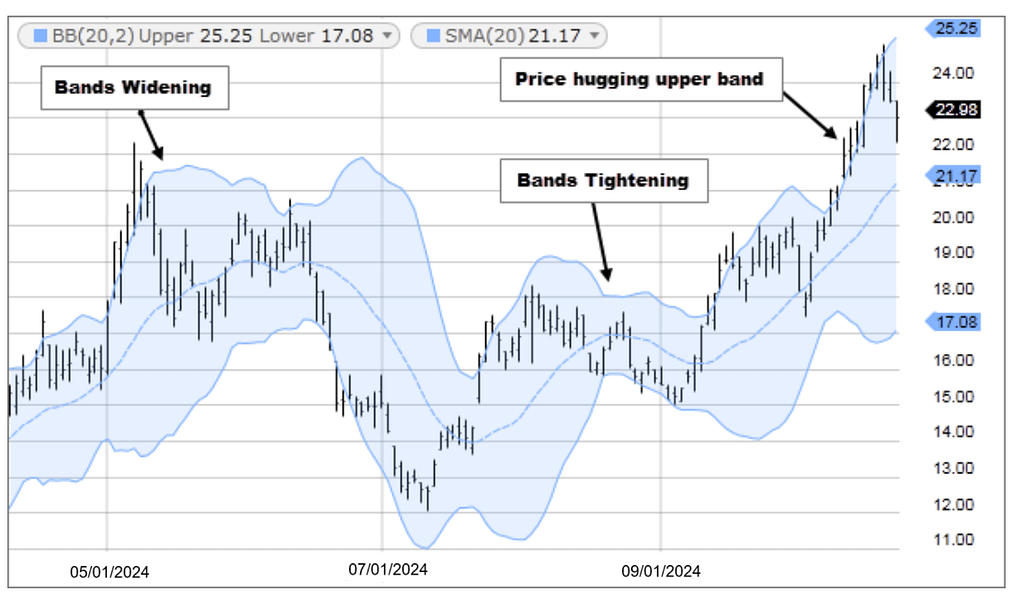
When market volatility is low, the bands tighten. This often happens before a major price move. Traders call this setup a “squeeze.” On the flip side, when volatility increases, the bands expand. This can suggest a trend is either strong or losing steam.
Prices tend to bounce between the upper and lower bands. This behavior can help traders identify entry and exit points. For instance, if the price hits the lower band and then crosses above the SMA, the upper band may become a natural target.
If price moves outside the bands and stays there, it may indicate a strong trend. But if it quickly snaps back inside, it’s often a false breakout.
Study our last trading guide on Liquidity zones and stop losses.
How to Calculate Bollinger Bands
Here’s how to do the math:
- Choose a time period (most use 20).
- Calculate the SMA over that period.
- Calculate the standard deviation of prices for the same period.
- For the upper band, add two standard deviations to the SMA.
- For the lower band, subtract two standard deviations from the SMA.
Typical values used:
- Short-term: 10 SMA, 1.5 deviations
- Medium-term: 20 SMA, 2 deviations
- Long-term: 50 SMA, 2.5 deviations
These are starting points. You can adjust them based on your trading style.
Using Bollinger Bands for Trading
There are several ways traders use Bollinger Bands:
1. Identifying Trends
The direction of the middle band, which is the SMA, shows the trend. If it’s rising, we may be in an uptrend. If it’s falling, a downtrend could be forming. The width of the bands gives clues about how strong or weak that trend is.
2. Spotting Overbought and Oversold Zones
When the price touches the upper band, it may be overbought. This could be a signal to take profits or go short. If it hits the lower band, it may be oversold, pointing to a potential buying opportunity.
3. Trading the “Bounce”
This strategy assumes that price tends to return to the mean. If the price bounces off one band, traders may aim for the opposite band. This works well in sideways markets.
4. Watching for Breakouts
A breakout outside the bands, especially with high volume, could mean a new trend is starting. But be cautious. Not all breakouts hold. Use other indicators to confirm the move.
Bollinger Bands Cheat Sheet
| Action | What It Means | Common Reaction |
|---|---|---|
| Rising middle band | Possible uptrend | Look to buy or hold |
| Falling middle band | Possible downtrend | Look to sell or short |
| Bands narrowing | Low volatility | Prepare for breakout |
| Price above upper band | Overbought | Take profit or short |
| Price below lower band | Oversold | Buy or watch for bounce |
| Bounce from lower band | Price may target upper band | Set exit target |
| Bounce from upper band | Price may fall to lower band | Plan for downside |
| Price hugging upper band | Strong trend | Consider trend-following |
| Price drops outside lower band | Breakdown risk | Short or reduce exposure |
Upper Band Signals
When price reaches or moves above the upper band:
- It can signal overbought conditions
- It may show expanding volatility
- It could be a breakout beginning
But don’t jump to conclusions. Sometimes, price hugs the upper band for a long time in a strong trend. That doesn’t always mean a reversal is coming. Check volume or use RSI to confirm.
In sideways markets, traders often sell when price hits the upper band and rebuy near the middle or lower band.
Lower Band Signals
The lower band shows oversold potential:
- When price touches or dips below it, a bounce could be coming
- It may indicate panic selling or bearish strength
- Long dips below the lower band may show trend continuation
This band is often used as a buy zone in ranging markets. If price keeps falling and breaks through with volume, a downtrend may be forming. Confirm this with volume or momentum indicators.
What Tightening and Widening Bands Mean
Tightening Bands (Squeeze)
When the bands are close together:
- Volatility is low
- A big move could be coming
- There’s often no clear trend
Many traders wait for the breakout direction after a squeeze before entering trades.
Widening Bands
Wider bands suggest high volatility. This can mean:
- The market is reacting to news or events
- A new trend may be forming
It’s a double-edged sword. With more volatility comes more risk. Traders should adjust their position sizes or stop-loss levels.
How Reliable Are Bollinger Bands?
Their reliability depends on:
- The asset’s typical volatility
- The chosen settings (SMA period and standard deviations)
- Confirmation from other tools
For instance, using RSI or MACD can filter out bad trades. Volume also adds important context. If a breakout happens with high volume, it’s more likely to stick.
Bollinger Bands work best when used in combination with other analysis methods. Alone, they may give false signals, especially in very choppy markets.

Alternatives to Bollinger Bands
Some traders prefer or combine other tools:
- Keltner Channels
- Donchian Channels
- Moving Average Envelopes
- Average True Range (ATR)
These indicators offer similar insights but use different math or approaches.
Common Limitations
- Bollinger Bands are lagging. They reflect past prices, not future moves.
- In volatile markets, they can expand too much and give unclear signals.
- The default settings may not suit every asset or timeframe.
- They don’t show direction on their own. Use confirmation.
Avoiding False Signals
To reduce false alerts:
- Pair Bollinger Bands with RSI or MACD
- Use volume as confirmation
- Avoid trading during unclear squeezes
- Adjust the settings to suit your asset
Using a 25-period SMA or increasing the deviation to 2.5 can help reduce noise in volatile assets.
Final Thoughts
Bollinger Bands are a flexible and widely used tool in technical analysis. They adjust to volatility and give insight into price trends and potential reversal points. While simple to read, they offer deep insights when used with other indicators.
If you’re serious about improving your trading, this tool belongs in your toolkit. But remember: No single indicator works all the time. Combine Bollinger Bands with sound risk management and other signals to build your edge.
Let the bands guide you, but always trade with a plan.
Note: This article is for educational purposes and does not constitute financial advice.

Credit: Source link


