Close Menu
CatchTheBullCatchTheBull
  • Home
  • Crypto News
  • Bitcoin
  • Altcoin
  • Blockchain
  • Airdrops News
  • NFT News
What's Hot

Why Chainlink price could rally to $10 as oversold RSI signals a bounce

February 13, 2026

This Key Bitcoin Metric Signals That The Downside May Persist A Bit Longer

February 13, 2026

Trump-Linked Truth Social Files for Two Crypto ETFs Targeting Bitcoin, Ether, and CRO

February 13, 2026
Facebook X (Twitter) Instagram
CatchTheBullCatchTheBull
  • Home
  • Crypto News
  • Bitcoin
  • Altcoin
  • Blockchain
  • Airdrops News
  • NFT News
CatchTheBullCatchTheBull
Bitcoin

This Key Bitcoin Metric Signals That The Downside May Persist A Bit Longer

By WebDeskFebruary 13, 20264 Mins Read
This Key Bitcoin Metric Signals That The Downside May Persist A Bit Longer
Share
Facebook Twitter LinkedIn Pinterest Email

Trusted Editorial content, reviewed by leading industry experts and seasoned editors. Ad Disclosure

After a sharp pullback in Bitcoin’s price, there are speculations that the cryptocurrency market has shifted into a bearish phase, marking an end to the bull market. Despite this significant drop, a key metric is showing signs that the market pain is likely to continue, reinforcing this current downward pressure.

Bitcoin Metric Warns The Pullback Isn’t Over Yet

Bitcoin’s ongoing downside movement does not seem to have reached its climax yet. An indicator of the Bitcoin market that is closely monitored indicates that the current dip has not ended, and the correction may continue for a short time.

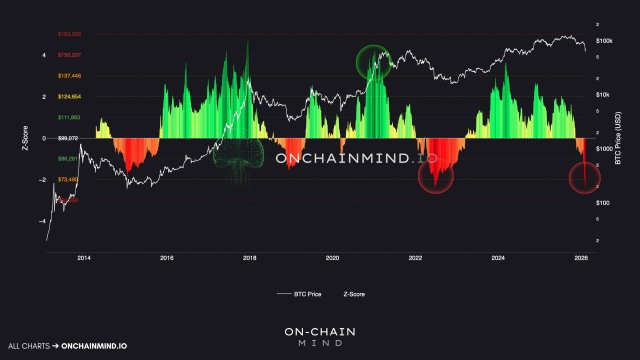
This data from the Bitcoin Z-Score metric suggests that selling pressure and weak demand conditions are highly likely to continue in the upcoming days, weeks, or even months. Following an analysis of the metric, On-Chain Mind disclosed that BTC has hit a -3σ downside deviation in the recent crash.

The -3σ downside deviation, which is sitting at the $60,000 price mark, is the most extreme statistical stretch in the history of BTC. On-Chain Mind outlined that a continued severe breakdown below this level now would be historically unprecedented.

Given the data from the metric, the crypto expert predicts that the negative chop will continue for a little while longer. Interestingly, the final bottoms are created by monotonous, choppy compression and now vertical crashes. In the meantime, the possibility of a continued short-term weakness before a stronger recovery emerges remains high.

Bitcoin
Source: Chart from On-Chain Mind on X

Darkfost, a market expert and author at CryptoQuant, has shed light on the current state of the BTC environment using the Bull Score Signals metric. This metric provides an overview of the market’s on-chain health and highlights multiple key elements affecting Bitcoin’s price behavior.

It further covers a variety of significant information regarding demand, liquidity, and the value of Bitcoin. Currently, the majority of these indicators are still in the red, which suggests that the environment is not improving yet. As long as this is the case, Bitcoin’s difficulty of reaching a new all-time high in the short term becomes extremely hard. 

Whales Under Pressure Due To BTC’s Drop

With a temporary break below $60,000, a wave of nervousness has been ignited across the market, putting Bitcoin whales under pressure. Despite popular opinion, these big holders do not consistently constitute a type of patient and logical smart money because they react to market shocks either opportunistically or under pressure.

Examining their inflows on the Binance platform, Darkfost has highlighted an increase in the monthly time frame. The monthly inflow rose from around 1,000 BTC to nearly 3,000 BTC, with a notable spike of roughly 12,000 BTC on February 6 alone. When there is significant price stress, this kind of action indicates that transfers to exchanges are more intense.

Since February 1, more than 50,000 BTC inflows were observed from this group, suggesting sensitivity to rapid market swings from the investors as they adjust their positions. These investors can abruptly influence price dynamics, which can be good in gauging the forces shaping the market. In an environment where overall market liquidity is tightening, rising inflows are often a sign of increased selling pressure.

Bitcoin
BTC trading at $66,141 on the 1D chart | Source: BTCUSDT on Tradingview.com

Featured image from Pngtree, chart from Tradingview.com

Editorial Process for bitcoinist is centered on delivering thoroughly researched, accurate, and unbiased content. We uphold strict sourcing standards, and each page undergoes diligent review by our team of top technology experts and seasoned editors. This process ensures the integrity, relevance, and value of our content for our readers.

Credit: Source link

Previous ArticleTrump-Linked Truth Social Files for Two Crypto ETFs Targeting Bitcoin, Ether, and CRO
Next Article Why Chainlink price could rally to $10 as oversold RSI signals a bounce

Related Posts

Why Chainlink price could rally to $10 as oversold RSI signals a bounce

February 13, 2026

Brazil Eyes 1 Million Bitcoin For National BTC Reserve

February 13, 2026

JPMorgan Keeps Bitcoin Bull Case: $266,000 Remains The Target

February 13, 2026
Add A Comment
Leave A Reply Cancel Reply

Top Posts

Why Chainlink price could rally to $10 as oversold RSI signals a bounce

February 13, 2026

This Key Bitcoin Metric Signals That The Downside May Persist A Bit Longer

February 13, 2026

Trump-Linked Truth Social Files for Two Crypto ETFs Targeting Bitcoin, Ether, and CRO

February 13, 2026

Subscribe to Updates

Get the latest Crypto, Blockchain and Airdrop News from us to Catch The Bull.

Advertisement Banner

Welcome to CatchTheBull, your trusted source for the latest Crypto News and Airdrops. We bring you real-time updates, expert insights, and opportunities to stay ahead in the crypto world. Discover trending projects, market analyses, and airdrop details all in one place.

Join us on this journey to navigate the ever-evolving blockchain universe!

Facebook X (Twitter) Instagram YouTube
Top Insights

Bybit x Block Scholes Report: Crypto Derivatives Markets Hit Most Extreme Positioning Since 2022 FTX Collapse

China extends crypto ban to stablecoins, tokenized real-world assets

Could Shiba Inu Gain Another Zero And Fall To $0.0000009?

Get Informed

Subscribe to Updates

Get the latest Crypto, Blockchain and Airdrop News from us to Catch The Bull.

© 2026 CatchTheBull. All Rights Are Reserved.
  • Contact Us
  • Privacy Policy
  • Terms of Use
  • DMCA

Type above and press Enter to search. Press Esc to cancel.

  • bitcoinBitcoin(BTC)$68,910.004.79%
  • ethereumEthereum(ETH)$2,056.887.00%
  • tetherTether(USDT)$1.000.03%
  • rippleXRP(XRP)$1.414.10%
  • binancecoinBNB(BNB)$619.842.21%
  • usd-coinUSDC(USDC)$1.000.00%
  • solanaSolana(SOL)$84.769.67%
  • tronTRON(TRX)$0.2822781.08%
  • dogecoinDogecoin(DOGE)$0.0971716.18%
  • Figure HelocFigure Heloc(FIGR_HELOC)$1.041.46%
  • bitcoin-cashBitcoin Cash(BCH)$563.7812.86%
  • whitebitWhiteBIT Coin(WBT)$51.814.24%
  • cardanoCardano(ADA)$0.2738465.64%
  • USDSUSDS(USDS)$1.000.10%
  • leo-tokenLEO Token(LEO)$8.42-1.22%
  • HyperliquidHyperliquid(HYPE)$31.535.54%
  • moneroMonero(XMR)$353.447.29%
  • Ethena USDeEthena USDe(USDE)$1.000.07%
  • chainlinkChainlink(LINK)$8.856.93%
  • CantonCanton(CC)$0.155888-4.99%
  • stellarStellar(XLM)$0.1659457.55%
  • USD1USD1(USD1)$1.000.02%
  • zcashZcash(ZEC)$272.6718.21%
  • litecoinLitecoin(LTC)$55.556.20%
  • hedera-hashgraphHedera(HBAR)$0.0976217.21%
  • daiDai(DAI)$1.000.00%
  • avalanche-2Avalanche(AVAX)$9.225.70%
  • paypal-usdPayPal USD(PYUSD)$1.00-0.02%
  • shiba-inuShiba Inu(SHIB)$0.0000067.01%
  • suiSui(SUI)$0.977.28%
  • the-open-networkToncoin(TON)$1.465.87%
  • RainRain(RAIN)$0.0100592.28%
  • crypto-com-chainCronos(CRO)$0.0790883.93%
  • World Liberty FinancialWorld Liberty Financial(WLFI)$0.104806-1.34%
  • tether-goldTether Gold(XAUT)$5,015.922.36%
  • MemeCoreMemeCore(M)$1.35-7.23%
  • pax-goldPAX Gold(PAXG)$5,044.832.33%
  • polkadotPolkadot(DOT)$1.345.78%
  • uniswapUniswap(UNI)$3.427.23%
  • mantleMantle(MNT)$0.645.32%
  • BlackRock USD Institutional Digital Liquidity FundBlackRock USD Institutional Digital Liquidity Fund(BUIDL)$1.000.00%
  • aaveAave(AAVE)$120.048.90%
  • AsterAster(ASTER)$0.733.65%
  • Falcon USDFalcon USD(USDF)$1.000.01%
  • bitget-tokenBitget Token(BGB)$2.380.61%
  • BittensorBittensor(TAO)$172.1514.05%
  • okbOKB(OKB)$77.535.20%
  • pepePepe(PEPE)$0.0000045.14%
  • SkySky(SKY)$0.0694415.04%
  • Circle USYCCircle USYC(USYC)$1.120.00%