Close Menu
CatchTheBullCatchTheBull
  • Home
  • Crypto News
  • Bitcoin
  • Altcoin
  • Blockchain
  • Airdrops News
  • NFT News
What's Hot

Hedera’s HBAR Price Up By 4% on BitTrade Debut Anticipation

March 24, 2026

TRON DAO targets agentic economy with $1B AI fund

March 24, 2026

Oracle ORCL Launches Agentic Applications Builder for Enterprise AI Automation

March 24, 2026
Facebook X (Twitter) Instagram
CatchTheBullCatchTheBull
  • Home
  • Crypto News
  • Bitcoin
  • Altcoin
  • Blockchain
  • Airdrops News
  • NFT News
CatchTheBullCatchTheBull
Blockchain

Solana Price Soars 4%, Glassnode Warns Of Bear Market Liquidity

By WebDeskDecember 10, 20254 Mins Read
Solana Price Soars 4%, Glassnode Warns Of Bear Market Liquidity
Share
Facebook Twitter LinkedIn Pinterest Email

Join Our Telegram channel to stay up to date on breaking news coverage

The Solana price has soared 4% in the last 24 hours to trade at $138 as of 3:55 a.m. EST on a 40% surge in daily trading volume to $6.5 billion.

This comes even as blockchain analytics firm Glassnode warns that Solana’s liquidity ”has contracted back to levels typically seen in deep bear markets.”

It added that for SOL that means realized losses now exceed realized profits.

The low liquidity warning suggests that even small trades could cause sharp price movements, making the market more volatile in the short term.

Liquidity can be assessed through several measures, including the Realized Profit-to-Loss Ratio (30D-SMA).
For Solana, this ratio has traded below 1 since mid-November, meaning realized losses now exceed realized profits. This signals that liquidity has contracted back to levels… https://t.co/KWA67kkGLm pic.twitter.com/cZELe5xzdD

— glassnode (@glassnode) December 10, 2025

Solana’s on-chain liquidity index has dropped back to zero, marking another clear “reset” phase similar to those seen in March, June, and November. Each of these resets has historically pushed SOL into a cooling period before liquidity gradually rebuilds during an “ignition” phase.

The chart highlights three major cycles lasting 79 days, 41 days, and 43 days. In all cases, liquidity collapses sharply, stays low for a short stretch, and then climbs again, often supporting a new price upswing.

Solana price

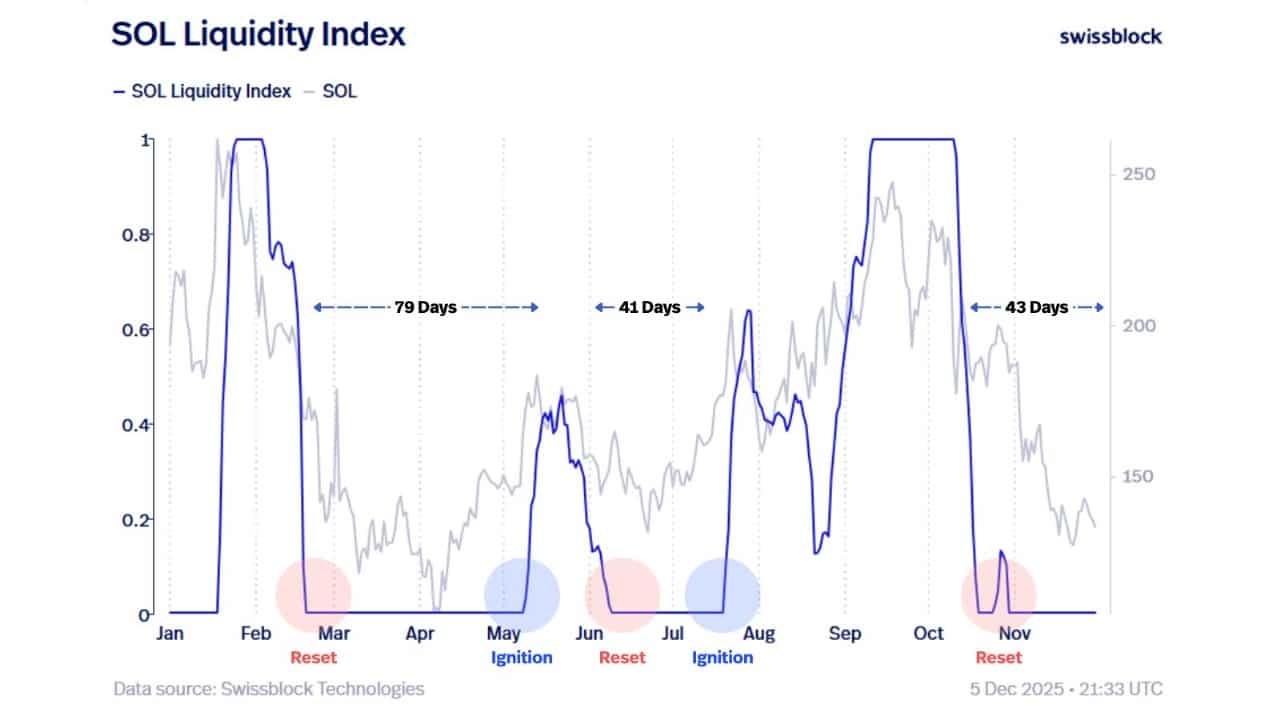
With the current November reset now confirmed, SOL is sitting in another low-liquidity pocket. If previous patterns repeat, the next move will depend on how quickly liquidity starts returning to the network.

A rising index has consistently signaled the beginning of fresh momentum for Solana, making this metric key to watching the next potential recovery stage.

Solana Holds Key Support As Descending Wedge Signals Possible Bullish Reversal

The SOLUSDT trading pair is near a major multi-month support zone around $130–$140, which has acted as a strong demand area in the past and even formed the base of a double-bottom pattern earlier in the year.

This support level has repeatedly stopped deeper sell-offs, making it an important region for bulls to defend. As long as SOL holds above this zone, the likelihood of a bullish reversal remains strong.

The price is currently positioned below both the 50-day SMA ($184.65) and the 200-day SMA ($169.79). This alignment shows that the broader trend is still bearish, with sellers maintaining overall control.

For bullish momentum to return, SOL must reclaim these two moving averages, as they will act as major resistance barriers on any upside attempt. A daily close above the 200-day SMA would be the first clear signal of trend recovery.

Solana priceSolana price

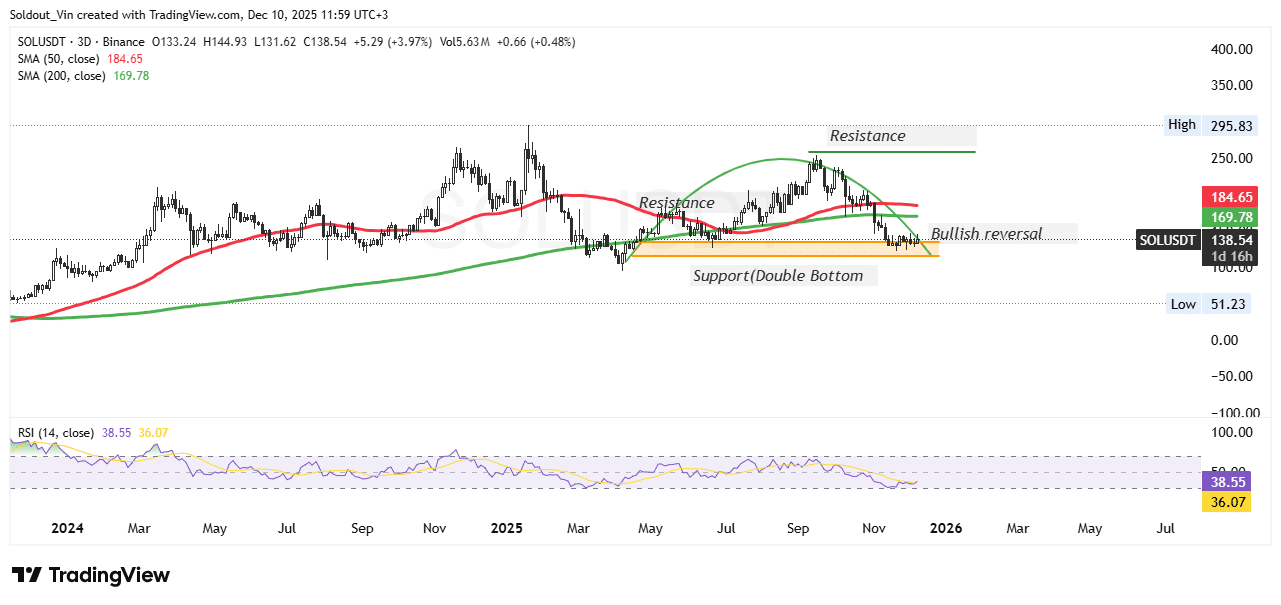
SOLUSDT Chart Analysis. Source: Tradingview

A descending wedge pattern is forming on the chart. This is typically a bullish reversal pattern, especially when it appears near a strong support zone. The wedge shows that the rate of decline is slowing, and sellers are losing strength. If SOL breaks above the wedge’s upper trendline, it could spark a move toward the next resistance levels.

The immediate resistance lies at $155–$160, an area where previous breakdowns occurred and where the price has struggled to move higher. A breakout above this range would likely attract new buyers and push the price toward the 200-day SMA. Above that, the next major zone sits between $200–$250, which aligns with previous swing highs and the upper resistance highlighted in the chart.

The RSI near 38 shows that SOL is close to oversold territory. This indicates that selling pressure may be easing and that the price could be preparing for a rebound. Failure to break these levels may result in the price consolidating or dropping slightly.

Related Articles:

Best Wallet – Diversify Your Crypto Portfolio

Best WalletBest Wallet
  • Easy to Use, Feature-Driven Crypto Wallet
  • Get Early Access to Upcoming Token ICOs
  • Multi-Chain, Multi-Wallet, Non-Custodial
  • Now On App Store, Google Play
  • Stake To Earn Native Token $BEST
  • 250,000+ Monthly Active Users

Best WalletBest Wallet


Join Our Telegram channel to stay up to date on breaking news coverage


Credit: Source link

Previous ArticleECB Plans Digital Euro Launch by 2029 to Enhance European Strategic Autonomy
Next Article The Best Crypto to Buy Now Isn’t Shiba Inu (SHIB), It’s This $0.035 DeFi Token Expected to Explode

Related Posts

Oracle ORCL Launches Agentic Applications Builder for Enterprise AI Automation

March 24, 2026

EigenCloud Launches Agentic Builder Series as India Eyes AI Agent Wave

March 24, 2026

Anthropic Launches Claude Computer Control Feature for Mac Users

March 23, 2026
Add A Comment
Leave A Reply Cancel Reply

Top Posts

Hedera’s HBAR Price Up By 4% on BitTrade Debut Anticipation

March 24, 2026

TRON DAO targets agentic economy with $1B AI fund

March 24, 2026

Oracle ORCL Launches Agentic Applications Builder for Enterprise AI Automation

March 24, 2026

Subscribe to Updates

Get the latest Crypto, Blockchain and Airdrop News from us to Catch The Bull.

Advertisement Banner

Welcome to CatchTheBull, your trusted source for the latest Crypto News and Airdrops. We bring you real-time updates, expert insights, and opportunities to stay ahead in the crypto world. Discover trending projects, market analyses, and airdrop details all in one place.

Join us on this journey to navigate the ever-evolving blockchain universe!

Facebook X (Twitter) Instagram YouTube
Top Insights

Only 5% of altcoins beat the 200‑day as volume collapses 80%

MoonPay Launches Open-Source Wallet Standard For AI Agents

Is Remittix a Scam or Legit? Breaking Down the $30M Crypto Presale

Get Informed

Subscribe to Updates

Get the latest Crypto, Blockchain and Airdrop News from us to Catch The Bull.

© 2026 CatchTheBull. All Rights Are Reserved.
  • Contact Us
  • Privacy Policy
  • Terms of Use
  • DMCA

Type above and press Enter to search. Press Esc to cancel.

  • bitcoinBitcoin(BTC)$71,106.004.41%
  • ethereumEthereum(ETH)$2,157.575.94%
  • tetherTether(USDT)$1.000.01%
  • rippleXRP(XRP)$1.423.89%
  • binancecoinBNB(BNB)$635.972.00%
  • usd-coinUSDC(USDC)$1.000.01%
  • solanaSolana(SOL)$91.667.27%
  • tronTRON(TRX)$0.3088590.85%
  • Figure HelocFigure Heloc(FIGR_HELOC)$1.031.04%
  • dogecoinDogecoin(DOGE)$0.0950526.25%
  • whitebitWhiteBIT Coin(WBT)$54.933.00%
  • USDSUSDS(USDS)$1.000.01%
  • cardanoCardano(ADA)$0.2649226.65%
  • bitcoin-cashBitcoin Cash(BCH)$478.582.89%
  • HyperliquidHyperliquid(HYPE)$38.293.21%
  • leo-tokenLEO Token(LEO)$9.431.31%
  • chainlinkChainlink(LINK)$9.217.08%
  • moneroMonero(XMR)$346.77-2.29%
  • Ethena USDeEthena USDe(USDE)$1.000.05%
  • CantonCanton(CC)$0.1456600.52%
  • stellarStellar(XLM)$0.1667597.14%
  • USD1USD1(USD1)$1.000.00%
  • daiDai(DAI)$1.00-0.03%
  • litecoinLitecoin(LTC)$55.774.17%
  • RainRain(RAIN)$0.0086441.27%
  • avalanche-2Avalanche(AVAX)$9.576.90%
  • hedera-hashgraphHedera(HBAR)$0.0941055.58%
  • paypal-usdPayPal USD(PYUSD)$1.000.04%
  • zcashZcash(ZEC)$230.526.28%
  • suiSui(SUI)$0.956.47%
  • shiba-inuShiba Inu(SHIB)$0.0000067.48%
  • the-open-networkToncoin(TON)$1.334.95%
  • crypto-com-chainCronos(CRO)$0.0757333.53%
  • MemeCoreMemeCore(M)$1.72-4.20%
  • BittensorBittensor(TAO)$309.9916.74%
  • World Liberty FinancialWorld Liberty Financial(WLFI)$0.10599410.26%
  • tether-goldTether Gold(XAUT)$4,412.893.69%
  • Circle USYCCircle USYC(USYC)$1.120.01%
  • polkadotPolkadot(DOT)$1.410.41%
  • mantleMantle(MNT)$0.714.30%
  • uniswapUniswap(UNI)$3.573.59%
  • pax-goldPAX Gold(PAXG)$4,420.793.55%
  • BlackRock USD Institutional Digital Liquidity FundBlackRock USD Institutional Digital Liquidity Fund(BUIDL)$1.000.00%
  • Pi NetworkPi Network(PI)$0.1893683.61%
  • okbOKB(OKB)$86.025.15%
  • Global DollarGlobal Dollar(USDG)$1.000.02%
  • Falcon USDFalcon USD(USDF)$1.000.06%
  • nearNEAR Protocol(NEAR)$1.325.32%
  • aaveAave(AAVE)$110.214.93%
  • SkySky(SKY)$0.0716374.08%