

Shiba Inu price prediction has catalyzed various major discussions among traders right now as SHIB trades near $0.00000888 following a 5 percent intraday bounce that happened earlier today. The move has actually lifted SHIB toward the midline of a descending channel that’s been in place since the second quarter, and while this Shiba Inu rebound shows some promise across several key technical indicators, sellers are still holding their ground at resistance zones overhead. Spot flows have remained weak at just $351,000 in net inflows, which raises questions about whether this recovery can sustain itself through multiple significant market pressures. The SHIB price resistance near $0.00000988 continues to cap upside attempts right now, and technical indicators are flashing mixed signals as momentum has accelerated on shorter timeframes but the broader structure stays bearish.
Also Read: Analysts Warn: Don’t Sell SHIB Before the Feb–March Recovery Zone
Shiba Inu Price Prediction And Rebound Amid Heavy Resistance
Channel Structure Limits Breakout Potential
The daily chart reveals that SHIB remains confined within a descending channel that has governed price action since mid-2025, and price sits below the 20, 50, 100, and also the 200-day exponential moving averages right now. A resistance cluster between $0.00000941 and $0.00001175 establishes a ceiling that needs breaking for any meaningful shift in the Shiba Inu price prediction to turn bullish across various major timeframes. The mid-channel resistance at $0.00000988 has actually stalled multiple breakout attempts during September and October, and the latest bounce appears to be just another reaction inside the broader downtrend rather than an actual reversal signal at this point.
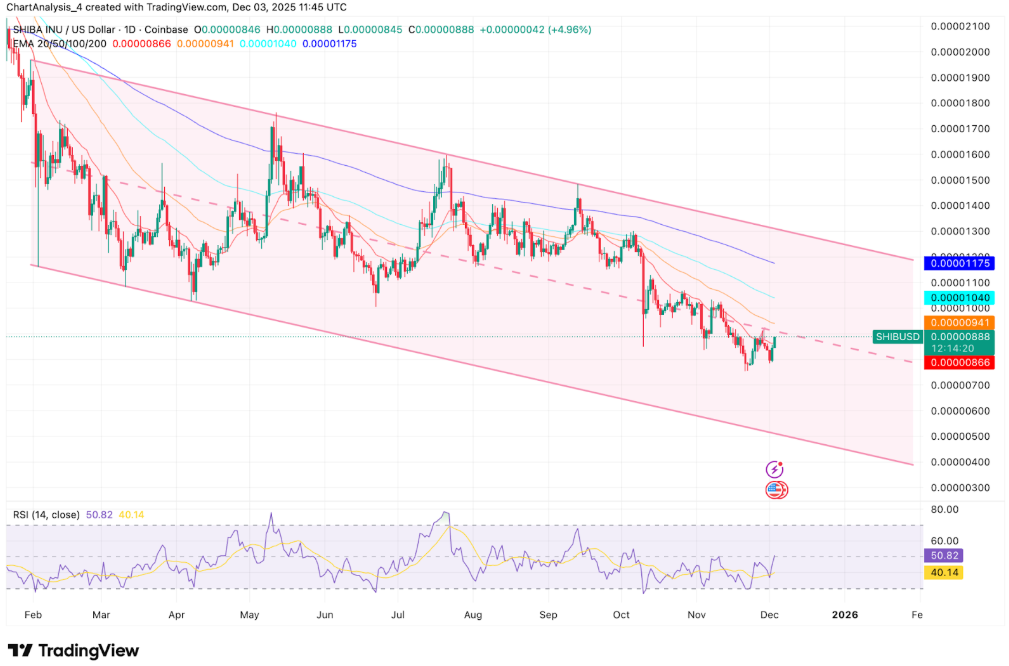
Traders find support at the lower boundary near $0.00000650, which is a zone that bulls have defended repeatedly over the past few months through several key tests and remains the critical level separating controlled decline from accelerated losses. The RSI indicator has recovered toward 50 but lacks the conviction to signal a trend reversal, reflecting stabilization instead of momentum right now. This creates uncertainty around the Shiba Inu forecast for the near term across numerous significant market conditions.
Short-Term Momentum Shows Promise But Needs Confirmation
On the 4-hour timeframe, SHIB has actually broken above short-term Supertrend resistance near $0.00000826, with Parabolic SAR dots flipping below price to signal an improvement in momentum. The breakout has leveraged relatively clean technical patterns but not forceful enough to confirm a structural change in market sentiment across various major indicators. Immediate resistance is positioned between $0.00000897 and $0.00000910, and a decisive push above that zone would force sellers to cover their positions, which could open a path toward the key $0.00000988 level that’s been mentioned multiple times.
The recent recovery has formed what appears to be a higher low, which is constructive for bulls as long as price stays above $0.00000826 right now. Losing that level would suggest the Shiba Inu rebound is fading and could trigger a return to lower support zones through several key breakdown levels. The SHIB price analysis shows that while technical momentum has improved somewhat, confirmation from volume and flows is still lacking at the time of writing across multiple essential market metrics.
Flows Stay Weak Despite Price Recovery
Spot flow data is reporting a modest net inflow of $351,000 on December 3, a modest positive print on what has been a consistent outflow trend since late August. These inflows have been too little to indicate sustainable accumulation even with the current price recovery, and the poor background of accumulation poses questions on the sustainability of ongoing bounce by the various major stress tests. The expectation of the price of Shiba Inu will depend on whether the buyers have the ability to overcome the resistance of the $0.00000988 and have the volume and conviction to carry them through at the present moment.
Also Read: Shiba Inu Delivers Massive 10% Rally: Is The Worst Over?
A positive move above that area and a daily close above $0.00001100 would trigger a possible reverse trend and open the (then) gate to $0.00001350 to even $0.00001500 within several weeks in a number of key momentum indicators. Conversely, the lack of SHIB price resistance may push the price back to $0.00000826 and lose that level will threaten to retest the price at the zone of support at $0.00000650. Provided that SHIB is able to recover the EMA cluster and leave the channel formation, sentiment would have a significant improvement in the form of many important validation points, though being beaten by a slim margin of $0.00000650 would indicate that the downward trend should continue and possibly permit further losses.
The price action of SHIB at this point indicates that caution is due at the current moment and the future of the Shiba Inu prediction is yet to be determined until they hit these key levels and are either held or broken on with confidence by the various important trading sessions.
Credit: Source link


