Close Menu
CatchTheBullCatchTheBull
  • Home
  • Crypto News
  • Bitcoin
  • Altcoin
  • Blockchain
  • Airdrops News
  • NFT News
What's Hot

Hyperliquid Season 3 Farming: A Complete Guide

March 21, 2026

Bitcoin Shows Steady Stream Of Outflows On Binance — What This Means

March 21, 2026

Airdrop Farming Bear Market: Opportunities in Fear

March 21, 2026
Facebook X (Twitter) Instagram
CatchTheBullCatchTheBull
  • Home
  • Crypto News
  • Bitcoin
  • Altcoin
  • Blockchain
  • Airdrops News
  • NFT News
CatchTheBullCatchTheBull
Bitcoin

Mastering Bitcoin On-Chain Data

By WebDeskFebruary 18, 20254 Mins Read
Mastering Bitcoin On-Chain Data
Share
Facebook Twitter LinkedIn Pinterest Email

Bitcoin’s price movements dominate headlines, but the real story of BTC lies beneath the surface. Beyond technical analysis and price speculation, on-chain data offers an unparalleled view of supply, demand, and investor behavior in real time. By leveraging these insights, traders and investors can anticipate market trends, follow institutional movements, and make data-driven decisions.

For a more in-depth look into this topic, check out a recent YouTube video here: Mastering Bitcoin On-Chain Data

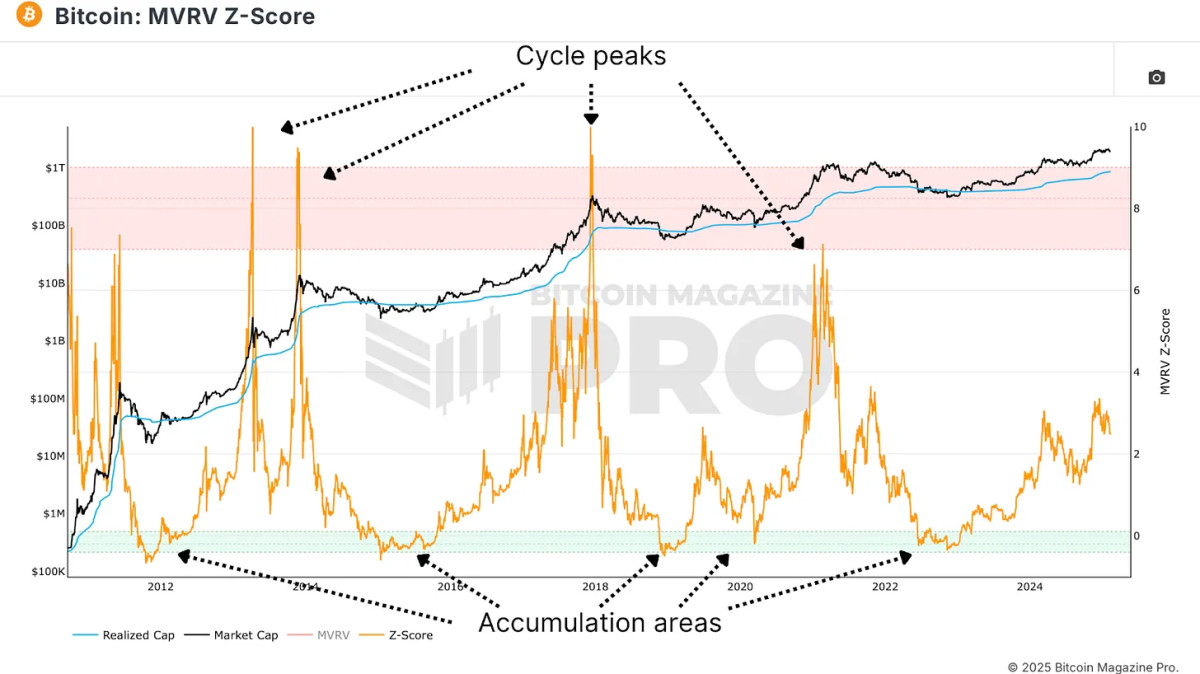
Realized Price & MVRV Z-Score

On-chain data refers to the publicly available transaction records on Bitcoin’s blockchain. Unlike traditional markets, where investor actions are obscured, Bitcoin’s transparency allows for real-time analysis of every transaction, wallet movement, and network activity. This information helps investors identify major trends, accumulation zones, and potential price inflection points.

One of the most crucial on-chain metrics is Realized Price, which reflects the average cost basis of all BTC in circulation. Unlike traditional assets, where investor cost bases are difficult to determine, Bitcoin provides real-time visibility into when the majority of holders are in profit or loss.

Figure 1: The Realized Price shows the cost-basis for all BTC on the network.

View Live Chart 🔍

To enhance the utility of Realized Price, analysts employ the MVRV Z-Score, which measures the deviation between market value and realized value, standardized for Bitcoin’s volatility. This indicator has historically identified optimal buying zones when it enters the lower range and potential overvaluation when it enters the red zone.

Figure 2: MVRV Z-Score has historically identified market tops and bottoms.

View Live Chart 🔍

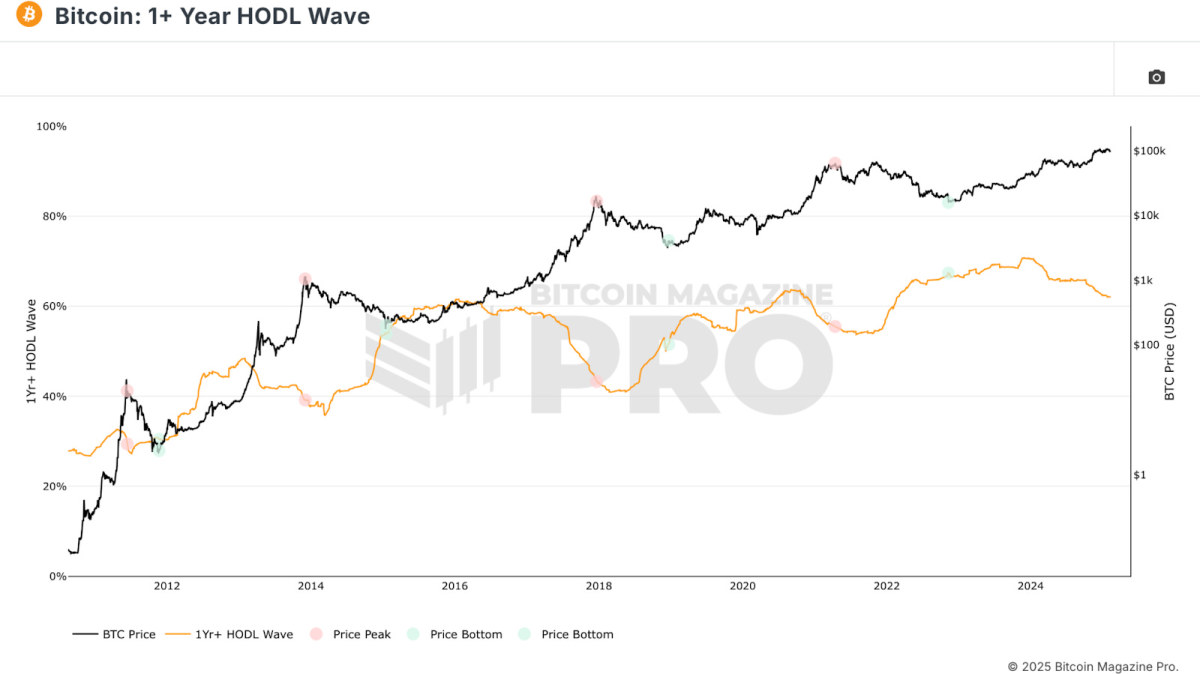
Monitoring Long-Term Holders

Another key metric is the 1+ Year HODL Wave, which tracks Bitcoin addresses that haven’t moved funds for at least a year. A rising HODL wave indicates that investors are choosing to hold, reducing circulating supply and creating upward price pressure. Conversely, when this metric starts declining, it suggests profit-taking and potential distribution.

Figure 3: 1+ Year HODL Wave shows the cyclical nature of BTC holders.

View Live Chart 🔍

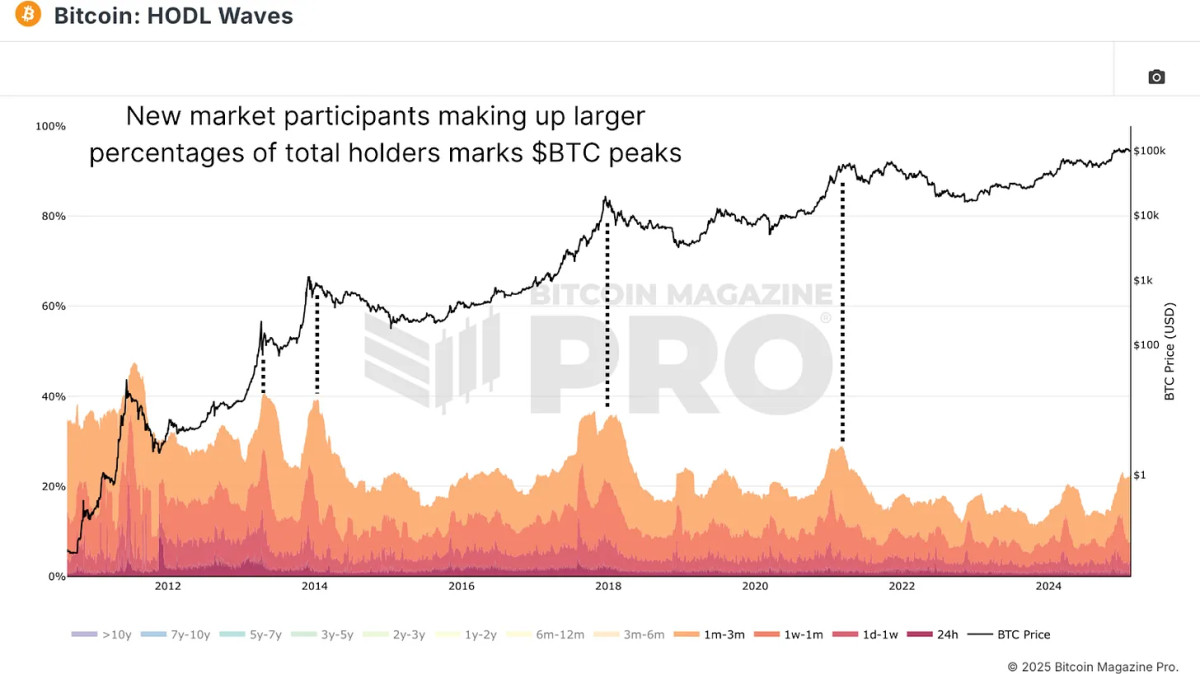
HODL Waves visualizes the entire distribution of Bitcoin ownership by age bands. Filtering to new market participants of 3 months or less reveals typical retail participation levels. Peaks in short-term holders typically signal market tops, while low levels indicate ideal accumulation zones.

Figure 4: HODL Waves can show when retail is experiencing FOMO.

View Live Chart 🔍

Spotting Whale Movements

Supply Adjusted Coin Days Destroyed quantifies the total BTC moved, weighted by how long it was held, and standardizes that data by the circulating supply at that time. For example:

  • 1 BTC held for 100 days → 100 Coin Days Destroyed
  • 0.1 BTC held for 1,000 days → 100 Coin Days Destroyed

This metric is invaluable for detecting whale activity and institutional profit-taking. When long-dormant coins suddenly move, it often signals large holders exiting positions. Historical data confirms that spikes in this data point align with major market tops and bottoms, reinforcing its value in cycle analysis.

Figure 5: Supply Adjusted CDD shows the velocity of BTC transactions.

View Live Chart 🔍

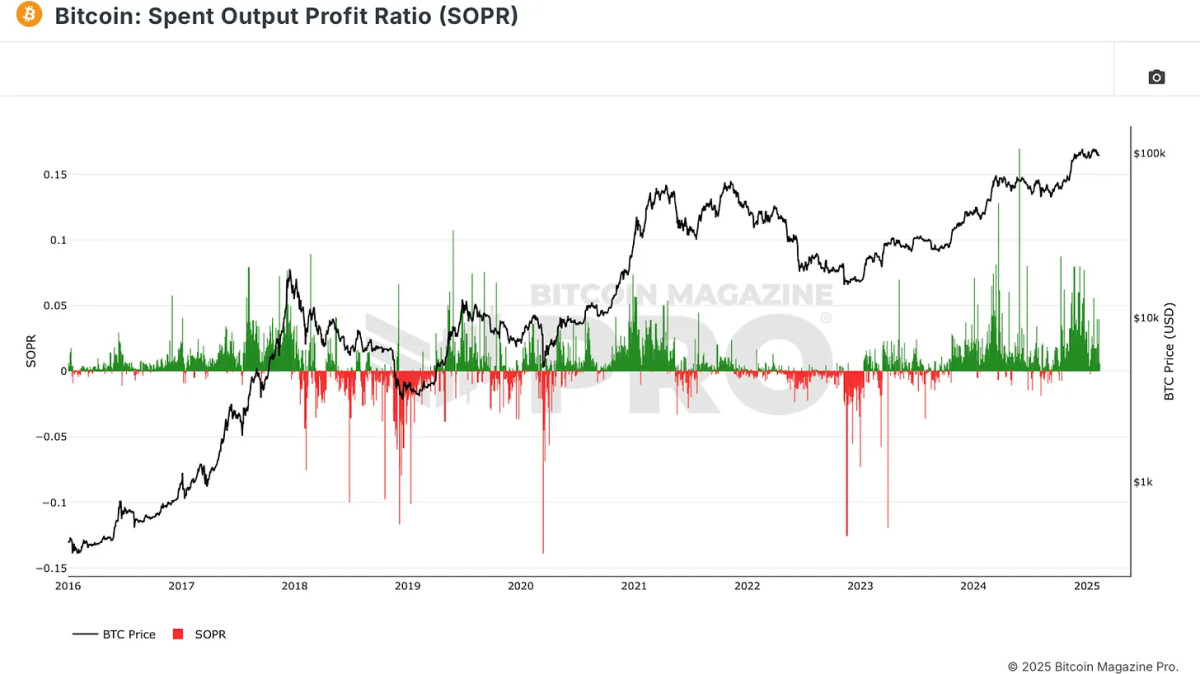
Realized Gains & Losses

The Spent Output Profit Ratio (SOPR) reveals the profitability of BTC transactions. A SOPR value above 0 indicates that the average Bitcoin being moved is in profit, while a value below 0 means the average sale is at a loss. By observing SOPR spikes, traders can identify euphoric profit-taking, while SOPR declines often accompany bear market capitulations.

Figure 6: SOPR shows the real-time realized euphoria and capitulation.

View Live Chart 🔍

Relying on a single metric can be misleading. To increase the probability of accurate signals, investors should seek confluence between multiple on-chain indicators.

For example, when:

  • MVRV Z-score is in the green zone (undervalued)
  • SOPR indicates high realized losses (capitulation)
  • HODL waves show a decline in short-term holders (selling exhaustion)

This alignment historically marks optimal accumulation zones. You should also look for confluence for any planned profit-taking for your BTC holdings, looking for the above metrics all signaling the opposite to outline overheated market conditions.

Conclusion

Bitcoin’s on-chain data provides a transparent, real-time view of market dynamics, offering investors an edge in decision-making. By tracking supply trends, investor psychology, and accumulation/distribution cycles, Bitcoiners can better position themselves for long-term success.

Explore live data, charts, indicators, and in-depth research to stay ahead of Bitcoin’s price action at Bitcoin Magazine Pro.

Disclaimer: This article is for informational purposes only and should not be considered financial advice. Always do your own research before making any investment decisions.

Credit: Source link

Previous ArticleItaly Strengthens Crypto Regulations Through Industry Consultation
Next Article What Will Shiba Inu (SHIB) Be Worth in 2035?

Related Posts

Bitcoin Shows Steady Stream Of Outflows On Binance — What This Means

March 21, 2026

Ripple issues urgent alert about fake telegram accounts

March 21, 2026

Bitcoin Market Not Ready For Expansion Yet — Blockchain Firm

March 21, 2026
Add A Comment
Leave A Reply Cancel Reply

Top Posts

Hyperliquid Season 3 Farming: A Complete Guide

March 21, 2026

Bitcoin Shows Steady Stream Of Outflows On Binance — What This Means

March 21, 2026

Airdrop Farming Bear Market: Opportunities in Fear

March 21, 2026

Subscribe to Updates

Get the latest Crypto, Blockchain and Airdrop News from us to Catch The Bull.

Advertisement Banner

Welcome to CatchTheBull, your trusted source for the latest Crypto News and Airdrops. We bring you real-time updates, expert insights, and opportunities to stay ahead in the crypto world. Discover trending projects, market analyses, and airdrop details all in one place.

Join us on this journey to navigate the ever-evolving blockchain universe!

Facebook X (Twitter) Instagram YouTube
Top Insights

BTC Price Holds $70K as Analysts Spot Cycle Reset Signs

What AI Says About SHIB If ETF Passes Will Surprise You

NEAR Price Prediction: Protocol Tests $1.38 Resistance as Bulls Eye March Breakout

Get Informed

Subscribe to Updates

Get the latest Crypto, Blockchain and Airdrop News from us to Catch The Bull.

© 2026 CatchTheBull. All Rights Are Reserved.
  • Contact Us
  • Privacy Policy
  • Terms of Use
  • DMCA

Type above and press Enter to search. Press Esc to cancel.

  • bitcoinBitcoin(BTC)$70,351.000.27%
  • ethereumEthereum(ETH)$2,150.750.82%
  • tetherTether(USDT)$1.00-0.01%
  • rippleXRP(XRP)$1.440.15%
  • binancecoinBNB(BNB)$641.450.21%
  • usd-coinUSDC(USDC)$1.00-0.01%
  • solanaSolana(SOL)$89.800.82%
  • tronTRON(TRX)$0.3104090.01%
  • Figure HelocFigure Heloc(FIGR_HELOC)$1.00-0.01%
  • dogecoinDogecoin(DOGE)$0.0940440.42%
  • USDSUSDS(USDS)$1.00-0.01%
  • whitebitWhiteBIT Coin(WBT)$54.97-0.41%
  • cardanoCardano(ADA)$0.2648890.42%
  • HyperliquidHyperliquid(HYPE)$40.151.84%
  • bitcoin-cashBitcoin Cash(BCH)$467.75-0.05%
  • leo-tokenLEO Token(LEO)$9.220.23%
  • chainlinkChainlink(LINK)$9.070.32%
  • moneroMonero(XMR)$347.051.19%
  • Ethena USDeEthena USDe(USDE)$1.000.00%
  • CantonCanton(CC)$0.1453220.54%
  • stellarStellar(XLM)$0.1653240.51%
  • USD1USD1(USD1)$1.000.04%
  • daiDai(DAI)$1.000.00%
  • litecoinLitecoin(LTC)$55.840.41%
  • RainRain(RAIN)$0.008586-5.32%
  • avalanche-2Avalanche(AVAX)$9.49-0.40%
  • paypal-usdPayPal USD(PYUSD)$1.00-0.02%
  • hedera-hashgraphHedera(HBAR)$0.0930860.22%
  • zcashZcash(ZEC)$231.60-0.66%
  • suiSui(SUI)$0.960.31%
  • shiba-inuShiba Inu(SHIB)$0.000006-0.03%
  • crypto-com-chainCronos(CRO)$0.074986-0.04%
  • the-open-networkToncoin(TON)$1.261.33%
  • MemeCoreMemeCore(M)$1.64-3.41%
  • World Liberty FinancialWorld Liberty Financial(WLFI)$0.0967054.29%
  • BittensorBittensor(TAO)$272.261.07%
  • tether-goldTether Gold(XAUT)$4,495.12-0.19%
  • polkadotPolkadot(DOT)$1.49-1.09%
  • mantleMantle(MNT)$0.750.50%
  • Circle USYCCircle USYC(USYC)$1.120.00%
  • pax-goldPAX Gold(PAXG)$4,511.78-0.06%
  • uniswapUniswap(UNI)$3.58-0.21%
  • BlackRock USD Institutional Digital Liquidity FundBlackRock USD Institutional Digital Liquidity Fund(BUIDL)$1.000.00%
  • Pi NetworkPi Network(PI)$0.1981163.94%
  • okbOKB(OKB)$88.11-0.49%
  • SkySky(SKY)$0.0778545.51%
  • Global DollarGlobal Dollar(USDG)$1.000.00%
  • Falcon USDFalcon USD(USDF)$1.00-0.06%
  • nearNEAR Protocol(NEAR)$1.32-0.13%
  • aaveAave(AAVE)$111.721.13%