Close Menu
CatchTheBullCatchTheBull
  • Home
  • Crypto News
  • Bitcoin
  • Altcoin
  • Blockchain
  • Airdrops News
  • NFT News
What's Hot

SEC Chief Reinforces Crypto Framework With Clearer Token Classification Boundaries – Regulation Bitcoin News

March 24, 2026

Google Expands Gemini AI on Google TV With Three New Features

March 24, 2026

Circle stock crashes 22% as U.S. bill targets stablecoin rewards

March 24, 2026
Facebook X (Twitter) Instagram
CatchTheBullCatchTheBull
  • Home
  • Crypto News
  • Bitcoin
  • Altcoin
  • Blockchain
  • Airdrops News
  • NFT News
CatchTheBullCatchTheBull
Bitcoin

Ethereum Enters Compression Zone – ETH/BTC Chart Shows Low Volatility May Not Last Long

By WebDeskMay 8, 20254 Mins Read
Ethereum Enters Compression Zone – ETH/BTC Chart Shows Low Volatility May Not Last Long
Share
Facebook Twitter LinkedIn Pinterest Email

Trusted Editorial content, reviewed by leading industry experts and seasoned editors. Ad Disclosure

After weeks of heavy selling pressure and persistent negative sentiment, Ethereum is finally showing signs of life. Bulls are stepping back in, attempting to reclaim critical price levels and reverse the bearish trend that has defined recent months. Despite the renewed momentum, ETH still trades below the key $2,000 mark—a level that must be breached to confirm a meaningful shift in market structure and set the stage for a sustained recovery.

As traders assess Ethereum’s outlook, attention is also turning to the ETH/BTC ratio, which has reached its lowest volatility level in more than two years. According to top analyst Daan, this metric has been in a prolonged downtrend, but has now stalled for over a month. Historically, such low-volatility periods often precede sharp directional moves, as the market builds pressure and prepares for a breakout or breakdown.

While Ethereum’s price remains technically fragile, the combination of reduced volatility, long-term support on the ETH/BTC pair, and renewed bullish momentum on the USD chart is creating a cautiously optimistic setup. The coming days will be crucial as ETH tests resistance. A confirmed breakout above $2,000 could be the signal that Ethereum’s next leg higher is about to begin.

Ethereum Struggles Below $1,900 As Risk And Uncertainty Dominate

Ethereum is facing renewed pressure after failing to break above the $1,874 high set on May 1st, leaving bulls with the urgent task of reclaiming momentum before volatility takes over. The asset is currently trading near critical support, unable to establish a clear direction as global markets remain fragile. With Ethereum still down more than 55% from its December highs, the bearish price structure remains intact, and any further weakness could trigger deeper downside.

Market volatility is being fueled by macroeconomic uncertainty, particularly as the U.S. and China continue to engage in high-stakes trade negotiations. Investors are cautious, and Ethereum’s inability to show strength amid a broader crypto recovery is raising concerns about its near-term outlook.

Adding to the complexity, Daan highlights that the ETH/BTC ratio is now at its lowest volatility level in over two years. While the ratio has been in a long-term downtrend, it has stalled for the past month, suggesting that a breakout (or breakdown) could be near.

ETH/BTC at the lowest volatility level it has been in 2+ years | Source: Daan on X

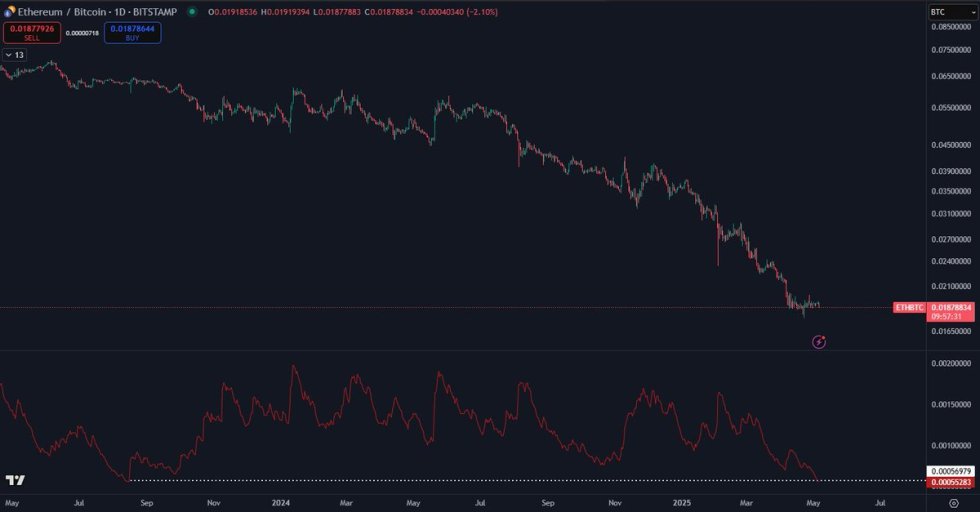
Historically, such compression periods often precede sharp moves. However, Daan notes that the low timeframe trend has not yet flipped bullish, and until it does, any rally should be treated with caution. For now, Ethereum remains stuck in limbo.

Price Action Details: ETH Testing

Ethereum is trading at $1,831, showing modest strength after bouncing from recent support near $1,780. On the 4-hour chart, ETH is attempting to establish a higher low and reclaim bullish momentum, but it still faces stiff resistance below the key $1,874 high from May 1st. Price is consolidating just above the 200-period EMA at $1,787 and the 200-period SMA at $1,699—two levels that have served as dynamic support and resistance zones throughout recent trading sessions.

Ethereum ranging below $1,850 and above $1,750 | Source: ETHUSDT chart on TradingView

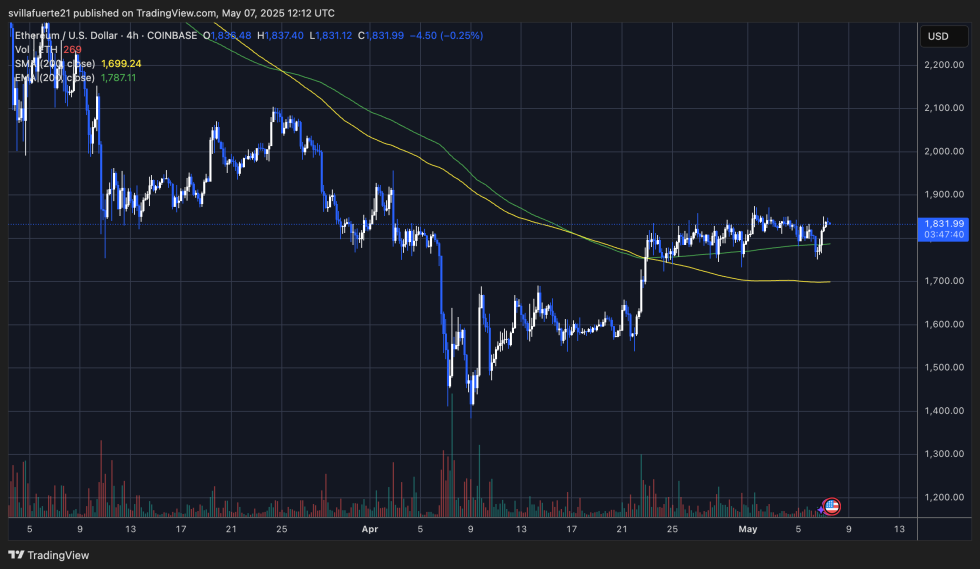
This sideways action highlights indecision as ETH struggles to break free from its range, with volatility compressing and volume remaining muted. A clean breakout above $1,874 could signal the start of a bullish leg targeting the psychological $2,000 mark. However, failure to hold above the $1,780–$1,750 region would likely invalidate the structure and open the door for further downside.

Technical indicators suggest that momentum is building, but not yet confirmed. Until Ethereum reclaims the $1,900–$2,000 range, the broader bearish trend remains in play. For now, ETH is in a critical zone where both bulls and bears have a case, making the next few sessions pivotal in determining whether Ethereum continues to recover or resumes its downtrend.

Featured image from Dall-E, chart from TradingView

Editorial Process for bitcoinist is centered on delivering thoroughly researched, accurate, and unbiased content. We uphold strict sourcing standards, and each page undergoes diligent review by our team of top technology experts and seasoned editors. This process ensures the integrity, relevance, and value of our content for our readers.

Credit: Source link

Previous ArticleDogWifHat (WIF) & Bonk (BONK) Price Prediction For Mid May 2025
Next Article Doodles Sets To Launch Its $DOOD NFT Coin This Friday, May 9

Related Posts

SEC Chief Reinforces Crypto Framework With Clearer Token Classification Boundaries – Regulation Bitcoin News

March 24, 2026

Circle stock crashes 22% as U.S. bill targets stablecoin rewards

March 24, 2026

TRON Expands AI Fund to $1B, Targeting Core Infrastructure for Agentic Economy

March 24, 2026
Add A Comment
Leave A Reply Cancel Reply

Top Posts

SEC Chief Reinforces Crypto Framework With Clearer Token Classification Boundaries – Regulation Bitcoin News

March 24, 2026

Google Expands Gemini AI on Google TV With Three New Features

March 24, 2026

Circle stock crashes 22% as U.S. bill targets stablecoin rewards

March 24, 2026

Subscribe to Updates

Get the latest Crypto, Blockchain and Airdrop News from us to Catch The Bull.

Advertisement Banner

Welcome to CatchTheBull, your trusted source for the latest Crypto News and Airdrops. We bring you real-time updates, expert insights, and opportunities to stay ahead in the crypto world. Discover trending projects, market analyses, and airdrop details all in one place.

Join us on this journey to navigate the ever-evolving blockchain universe!

Facebook X (Twitter) Instagram YouTube
Top Insights

FTX Payout March 2026: What to Expect Next

From OG Bitcoin Miner To Astronaut

What’s In Store For DOGE?

Get Informed

Subscribe to Updates

Get the latest Crypto, Blockchain and Airdrop News from us to Catch The Bull.

© 2026 CatchTheBull. All Rights Are Reserved.
  • Contact Us
  • Privacy Policy
  • Terms of Use
  • DMCA

Type above and press Enter to search. Press Esc to cancel.

  • bitcoinBitcoin(BTC)$70,014.00-1.14%
  • ethereumEthereum(ETH)$2,143.19-0.80%
  • tetherTether(USDT)$1.00-0.03%
  • binancecoinBNB(BNB)$635.26-0.46%
  • rippleXRP(XRP)$1.40-2.29%
  • usd-coinUSDC(USDC)$1.000.00%
  • solanaSolana(SOL)$89.69-2.08%
  • tronTRON(TRX)$0.3094221.71%
  • Figure HelocFigure Heloc(FIGR_HELOC)$1.041.23%
  • dogecoinDogecoin(DOGE)$0.094362-0.89%
  • USDSUSDS(USDS)$1.00-0.06%
  • whitebitWhiteBIT Coin(WBT)$54.35-0.94%
  • cardanoCardano(ADA)$0.2641620.79%
  • HyperliquidHyperliquid(HYPE)$40.176.27%
  • bitcoin-cashBitcoin Cash(BCH)$475.24-0.54%
  • leo-tokenLEO Token(LEO)$9.471.09%
  • chainlinkChainlink(LINK)$9.180.43%
  • moneroMonero(XMR)$345.65-1.97%
  • Ethena USDeEthena USDe(USDE)$1.00-0.05%
  • stellarStellar(XLM)$0.1694292.03%
  • CantonCanton(CC)$0.140147-2.69%
  • USD1USD1(USD1)$1.00-0.04%
  • litecoinLitecoin(LTC)$56.151.18%
  • daiDai(DAI)$1.00-0.03%
  • RainRain(RAIN)$0.0088140.60%
  • avalanche-2Avalanche(AVAX)$9.510.22%
  • hedera-hashgraphHedera(HBAR)$0.0937240.34%
  • paypal-usdPayPal USD(PYUSD)$1.000.03%
  • zcashZcash(ZEC)$230.800.21%
  • suiSui(SUI)$0.95-1.20%
  • shiba-inuShiba Inu(SHIB)$0.0000061.51%
  • the-open-networkToncoin(TON)$1.321.12%
  • BittensorBittensor(TAO)$337.2617.95%
  • crypto-com-chainCronos(CRO)$0.074975-1.00%
  • MemeCoreMemeCore(M)$1.71-2.46%
  • World Liberty FinancialWorld Liberty Financial(WLFI)$0.102745-0.97%
  • tether-goldTether Gold(XAUT)$4,459.801.21%
  • Circle USYCCircle USYC(USYC)$1.120.00%
  • polkadotPolkadot(DOT)$1.39-1.40%
  • mantleMantle(MNT)$0.710.50%
  • pax-goldPAX Gold(PAXG)$4,461.090.98%
  • uniswapUniswap(UNI)$3.590.27%
  • BlackRock USD Institutional Digital Liquidity FundBlackRock USD Institutional Digital Liquidity Fund(BUIDL)$1.000.00%
  • Pi NetworkPi Network(PI)$0.187222-1.94%
  • okbOKB(OKB)$86.380.34%
  • Global DollarGlobal Dollar(USDG)$1.000.00%
  • Falcon USDFalcon USD(USDF)$1.000.01%
  • aaveAave(AAVE)$111.020.73%
  • nearNEAR Protocol(NEAR)$1.30-0.84%
  • SkySky(SKY)$0.071813-2.09%