

XRP is back on traders’ radar. With volatility picking up and price dancing around key levels, it’s time to examine what’s really going on with this popular altcoin.
In this guide, we’ll break down the XRP trade set up, using clear charts, simple language, and a light approach that even beginners can follow. We’ll also explore potential upside targets and downside risks.
Let’s jump in.
XRP Price Overview
Right now, XRP is trading at $2.35 with a market cap of $138.14 billion. Its 24-hour trading volume stands at $58.62 billion, showing strong market activity.
The coin moved between $2.33 and $2.43 in the past 24 hours, signaling solid intraday volatility. Traders are active, but price action remains undecided.
Related: Study our series of trading guides to improve your skills.
1-Hour Chart Analysis
On the 1-hour chart, XRP is showing signs of a pullback. The trend is forming lower highs and lower lows, which points to short-term weakness.
The key support at $2.31 has been tested multiple times. If this level breaks, XRP might slide down to $2.20.
Volume also confirms this cautious tone. Red volume bars are more frequent than green ones. So, sellers are currently in control.
4-Hour Chart Perspective
Zooming out to the 4-hour chart, things don’t look much better.
XRP is still trending below the resistance at $2.44, which was previously a support zone. There’s a potential lower high forming, and momentum continues to drop.
After peaking at $2.656, XRP started correcting. Although large green volume spikes hinted at institutional buying, that momentum has since faded.
If XRP closes below $2.30, it opens the path toward the $2.20 zone. That would confirm the bearish outlook for the short term.
Daily Chart: Bulls Still in the Game?
Here’s where it gets interesting.
Despite the short-term weakness, the daily chart still looks bullish overall. XRP is making higher highs and higher lows, which is a classic sign of an uptrend. it broke a clear resistance we discussed last week, and now retested the line!
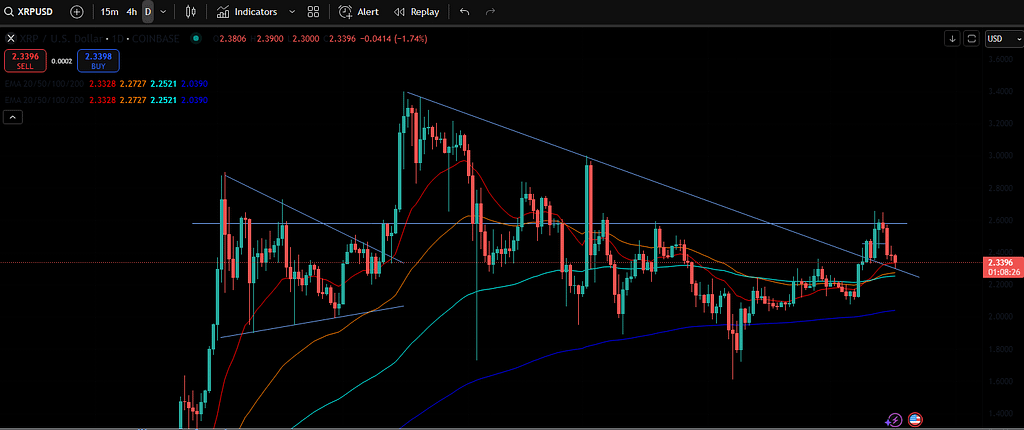
For bulls to reclaim control, XRP needs to close above the $2.40–$2.45 range on strong volume. If that happens, the next move could take it toward $2.60.
However, bulls must defend $2.30 at all costs. That level is a make-or-break line for any further upside.
Retesting of a prior resistance is always a great opportunity to scalp a long. While I was preparing this blog, it happened, and I took the trade and closed it. I front ran you guys, my bad.
Now I’m waiting for a second retest of the $2.30 line. We were rejected at a 4h EMA, so I closed the trade, patiently waiting for a second entry. This XRP trade set up is as clean as it gets. Lots of liquidity around that level, including several EMA’s on different timeframes.
Technical Indicators: A Mixed Bag
Let’s look at the indicators. Here’s a quick snapshot of what they say:
- RSI: 52.7 – Neutral, slightly leaning bearish.
- Stochastic: 50.6 – Flat, no clear trend.
- CCI: 22.9 – Mild bullish bias.
- ADX: 20.2 – Weak trend strength.
- Awesome Oscillator: 0.22 – Neutral.
- MACD: 0.071 – Slight bullish divergence.
So, indicators are not screaming “buy” or “sell”. Instead, they show a balanced market, with bulls and bears waiting for a breakout.
Moving Averages: Short-Term Pain, Long-Term Gain?
Here’s where it gets clearer:
- The 10-period EMA and SMA show sell signals – that’s short-term weakness.
- But all longer-term moving averages (20 to 200 periods) still flash buy.
- Notably, the 200 EMA at $2.03 and 200 SMA at $2.17 act as solid long-term support zones.
This tells us that while XRP may face pressure in the short term, the broader trend still favors the upside.
Current Market Mood
XRP is bouncing between $2.30 and $2.40, showing consolidation. With a market cap around $137.55 billion, XRP remains a dominant player, holding 4.20% of total crypto market share.
But the mood is uncertain. The daily RSI shows bearish convergence, while the EMA 50/200-day crossover remains neutral. This points to a slow increase in selling pressure, though it’s not overwhelming just yet.
Bullish Scenario
If XRP stays above $2.30 and breaks through $2.45 on high volume, we could see a move toward:
- $2.60 (previous high)
- Possibly even $2.75 if momentum returns
This would be supported by long-term buyers stepping in and trend continuation patterns playing out.
Bearish Scenario
If XRP fails to hold $2.30, expect a quick trip down to:
- $2.20 (first support)
- Then $2.10 if sell pressure builds
A daily close below these levels would damage the broader uptrend and invite further downside.
Key Levels to Watch
| Level | Type | Importance |
|---|---|---|
| $2.30 | Major Support | Must hold to stay bullish |
| $2.20 | Next Support | Short-term target for bears |
| $2.45 | Resistance | Breakout confirmation zone |
| $2.60 | Bullish Target | Upside potential if $2.45 breaks |
XRP Trade Set Up: Conclusion
So, what’s the clean XRP trade set up here?
It depends on your style:
- Bulls can look for long entries near $2.30, with tight stops below and targets around $2.60.
- Bears may short breakdowns below $2.30, aiming for $2.20 or lower.
- Neutral traders might wait for a clear breakout above $2.45, confirming bullish momentum.
The market is at a tipping point. Short-term trends show caution, but the long-term bias is still bullish—if key supports hold.
Final Words
XRP’s current setup is one of the most technical-friendly in the altcoin space. With clear resistance, solid support, and high liquidity, it’s a playground for traders who enjoy structure.
Just remember to trade with a plan, use stop losses, and always zoom out before going in.
If you liked this XRP trade set up breakdown, stay tuned—we’ve got more analysis coming soon!
If you enjoyed this blog, check out our recent blog about the Grass Token price.
As always, don’t forget to claim your bonus below on Bybit. See you next time!

Credit: Source link


