Close Menu
CatchTheBullCatchTheBull
  • Home
  • Crypto News
  • Bitcoin
  • Altcoin
  • Blockchain
  • Airdrops News
  • NFT News
What's Hot

Bitcoin Treasury Demand From Non-Strategy Firms Down 99%

March 27, 2026

Active Protection Mechanisms in Buy Programs — Redefining Stop-Loss and Deriving Exit Rules

March 27, 2026

Toncoin Faces Crucial At The $1 Range, Will It Hold Or Break?

March 27, 2026
Facebook X (Twitter) Instagram
CatchTheBullCatchTheBull
  • Home
  • Crypto News
  • Bitcoin
  • Altcoin
  • Blockchain
  • Airdrops News
  • NFT News
CatchTheBullCatchTheBull
Bitcoin

Bitcoin Market In Equilibrium: No Major Flow Between Old and Young Coins

By WebDeskAugust 18, 20254 Mins Read
Bitcoin Market In Equilibrium: No Major Flow Between Old and Young Coins
Share
Facebook Twitter LinkedIn Pinterest Email

Trusted Editorial content, reviewed by leading industry experts and seasoned editors. Ad Disclosure

Bitcoin is once again facing a crucial test after slipping below the $120,000 level, with selling pressure weighing on price action. The market has entered a clear consolidation phase, with BTC moving within a well-defined range between strong resistance above $120K and key supports below. Traders are closely watching these levels, as momentum appears to be fading following the recent rejection at cycle highs.

Some analysts warn that if Bitcoin loses its current range lows, further downside could follow as short-term holders (STH) begin to feel the pressure. Historically, such breakdowns have triggered volatility spikes, shaking out weaker hands before the next major trend emerges.

Supporting this outlook, the Bitcoin HODL Structure & 30-Day Flows chart reveals critical insights. The data highlights the balance between younger coins (STH) and long-term holders (LTH), showing that the share of STH has stabilized, pointing to a phase of consolidation. In this regime, market participants appear less eager to rotate coins, suggesting reduced short-term conviction and a waiting game for stronger directional cues.

Bitcoin HODL Structure Signals Equilibrium

According to top analyst Axel Adler, the Bitcoin HODL Structure and 30-day flows provide a clear picture of the current market regime. The chart tracks the share of short-term holders (STH, coins held for less than 6 months) in realized cap, shown as the orange line, alongside its 30-day change (STH 30d Δ), shown as the blue line.

Bitcoin HODL Structure & 30-Day Flows | Source: Axel Adler

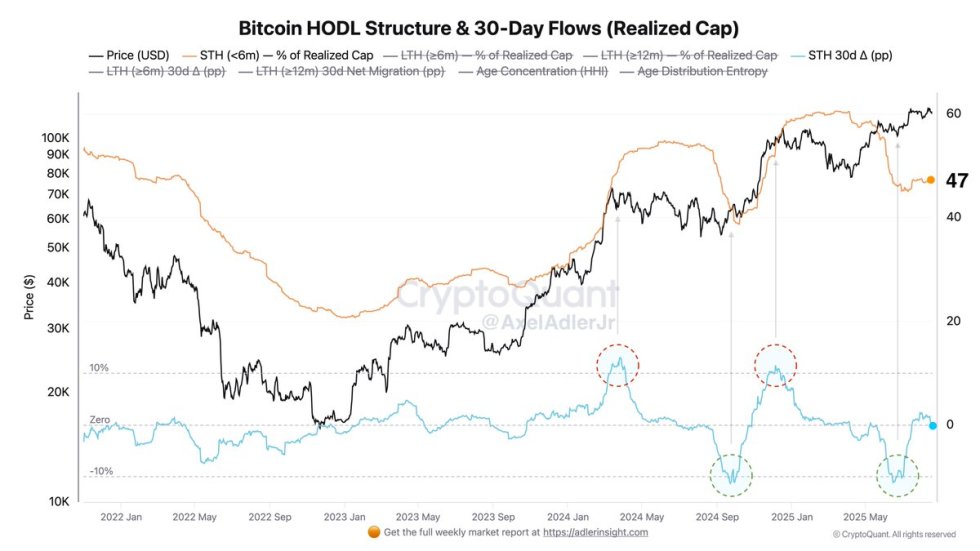
The blue curve highlights the net migration of value between younger and older coins. When the curve rises, it signals accelerating turnover and distribution from long-term holders (LTH) to STH, often marking overheated phases. Conversely, when the curve declines, it points to coin aging and the strengthening of “diamond hands,” typically observed during capitulation and recovery periods.

Currently, Bitcoin trades at all-time highs, with STH share at 47% and STH 30d Δ sitting at 0. This means there has been no notable flow between young and old cohorts over the past month. Adler explains that such conditions reflect an equilibrium regime, where neither new speculative demand nor heavy long-term distribution dominates.

Historically, spikes in the Δ above 10 percentage points (red markers) coincided with local tops and overheating phases, while deep drops below -10 (green markers) marked capitulation and rebound zones. With zero Δ at ATH, Adler suggests the base case scenario is consolidation, with neutral short-term pressure. This equilibrium hints that Bitcoin may stabilize at high levels before its next decisive move.

Price Action Details: Key Levels To Watch

Bitcoin’s 4-hour chart shows increased volatility following the rejection at the $123,217 resistance level. After testing this zone twice in August, BTC failed to sustain momentum, leading to a sharp reversal. The latest decline has pushed the price back toward $115,121, with the market now trading below key short-term moving averages.

BTC 4-hour price structure | Source: BTCUSDT chart on TradingView

The 50 SMA ($118,927) and 100 SMA ($116,982) acted as resistance during the retracement, while the 200 SMA ($117,514) was also breached, signaling weakening short-term momentum. The loss of these levels confirms sellers’ control, as BTC now trades below all major moving averages on this timeframe.

The consolidation between $114K and $118K highlights a critical decision zone. If BTC loses $114K decisively, downside targets could extend toward $110K–$112K, aligning with previous support levels and reinforcing a deeper correction scenario. On the flip side, reclaiming $118K would be an important signal of renewed strength, potentially opening another test of the $123K resistance.

Featured image from Dall-E, chart from TradingView

Editorial Process for bitcoinist is centered on delivering thoroughly researched, accurate, and unbiased content. We uphold strict sourcing standards, and each page undergoes diligent review by our team of top technology experts and seasoned editors. This process ensures the integrity, relevance, and value of our content for our readers.

Credit: Source link

Previous ArticleEthereum Leads Digital Asset Inflows; Market Reaches Record $244 Billion
Next Article Faraday Future pivots to crypto and AI as car sales falter

Related Posts

Bitcoin Treasury Demand From Non-Strategy Firms Down 99%

March 27, 2026

Toncoin Faces Crucial At The $1 Range, Will It Hold Or Break?

March 27, 2026

Morgan Stanley’s Bitcoin ETF Nears Launch on NYSE – Crypto News Bitcoin News

March 26, 2026
Add A Comment
Leave A Reply Cancel Reply

Top Posts

Bitcoin Treasury Demand From Non-Strategy Firms Down 99%

March 27, 2026

Active Protection Mechanisms in Buy Programs — Redefining Stop-Loss and Deriving Exit Rules

March 27, 2026

Toncoin Faces Crucial At The $1 Range, Will It Hold Or Break?

March 27, 2026

Subscribe to Updates

Get the latest Crypto, Blockchain and Airdrop News from us to Catch The Bull.

Advertisement Banner

Welcome to CatchTheBull, your trusted source for the latest Crypto News and Airdrops. We bring you real-time updates, expert insights, and opportunities to stay ahead in the crypto world. Discover trending projects, market analyses, and airdrop details all in one place.

Join us on this journey to navigate the ever-evolving blockchain universe!

Facebook X (Twitter) Instagram YouTube
Top Insights

XRP Shows Unusual Stability As Volatility Hits 2026 Low – Here’s What This Means

Outset Media Index (OMI) Introduces Data-Driven Framework for Media Analysis

XRP Longs Build as $5–$10 Targets Stay Firm Among Analysts

Get Informed

Subscribe to Updates

Get the latest Crypto, Blockchain and Airdrop News from us to Catch The Bull.

© 2026 CatchTheBull. All Rights Are Reserved.
  • Contact Us
  • Privacy Policy
  • Terms of Use
  • DMCA

Type above and press Enter to search. Press Esc to cancel.

  • bitcoinBitcoin(BTC)$68,715.00-1.82%
  • ethereumEthereum(ETH)$2,064.07-2.64%
  • tetherTether(USDT)$1.00-0.01%
  • binancecoinBNB(BNB)$627.98-0.99%
  • rippleXRP(XRP)$1.36-1.86%
  • usd-coinUSDC(USDC)$1.000.00%
  • solanaSolana(SOL)$86.20-3.09%
  • tronTRON(TRX)$0.3148190.04%
  • Figure HelocFigure Heloc(FIGR_HELOC)$1.02-0.55%
  • dogecoinDogecoin(DOGE)$0.091984-0.45%
  • USDSUSDS(USDS)$1.00-0.01%
  • whitebitWhiteBIT Coin(WBT)$52.78-2.03%
  • cardanoCardano(ADA)$0.253791-2.93%
  • bitcoin-cashBitcoin Cash(BCH)$466.630.16%
  • HyperliquidHyperliquid(HYPE)$38.74-0.25%
  • leo-tokenLEO Token(LEO)$9.550.39%
  • chainlinkChainlink(LINK)$8.90-2.12%
  • moneroMonero(XMR)$332.17-0.95%
  • Ethena USDeEthena USDe(USDE)$1.00-0.04%
  • stellarStellar(XLM)$0.1740090.13%
  • CantonCanton(CC)$0.1469534.39%
  • USD1USD1(USD1)$1.00-0.01%
  • daiDai(DAI)$1.000.00%
  • litecoinLitecoin(LTC)$55.00-0.67%
  • hedera-hashgraphHedera(HBAR)$0.091035-0.90%
  • avalanche-2Avalanche(AVAX)$9.08-3.74%
  • paypal-usdPayPal USD(PYUSD)$1.00-0.03%
  • zcashZcash(ZEC)$224.49-0.08%
  • MemeCoreMemeCore(M)$2.09-14.61%
  • suiSui(SUI)$0.92-1.88%
  • shiba-inuShiba Inu(SHIB)$0.000006-1.13%
  • RainRain(RAIN)$0.007151-16.05%
  • BittensorBittensor(TAO)$336.14-1.24%
  • crypto-com-chainCronos(CRO)$0.073680-0.54%
  • the-open-networkToncoin(TON)$1.23-5.55%
  • World Liberty FinancialWorld Liberty Financial(WLFI)$0.097741-2.25%
  • Circle USYCCircle USYC(USYC)$1.120.00%
  • tether-goldTether Gold(XAUT)$4,459.430.48%
  • mantleMantle(MNT)$0.70-0.75%
  • pax-goldPAX Gold(PAXG)$4,466.760.60%
  • uniswapUniswap(UNI)$3.51-2.52%
  • polkadotPolkadot(DOT)$1.32-0.06%
  • BlackRock USD Institutional Digital Liquidity FundBlackRock USD Institutional Digital Liquidity Fund(BUIDL)$1.000.00%
  • Global DollarGlobal Dollar(USDG)$1.000.00%
  • Pi NetworkPi Network(PI)$0.180534-3.97%
  • okbOKB(OKB)$85.100.15%
  • Falcon USDFalcon USD(USDF)$1.00-0.02%
  • SkySky(SKY)$0.070997-2.66%
  • AsterAster(ASTER)$0.671.10%
  • aaveAave(AAVE)$105.70-2.20%