Close Menu
CatchTheBullCatchTheBull
  • Home
  • Crypto News
  • Bitcoin
  • Altcoin
  • Blockchain
  • Airdrops News
  • NFT News
What's Hot

Ethereum Exchange Reserves Hit a 10-Year Low—Is a Supply Shock Brewing?

June 16, 2026

Ethereum Clear Signing Push Aims To Make Wallet Approvals Safer

June 16, 2026

Ripple CEO Reveals Why Banks Aren’t Embracing XRP at Scale

June 16, 2026
Facebook X (Twitter) Instagram
CatchTheBullCatchTheBull
  • Home
  • Crypto News
  • Bitcoin
  • Altcoin
  • Blockchain
  • Airdrops News
  • NFT News
CatchTheBullCatchTheBull
Crypto News

BTC Holds Firm Above $66K: Sustainable Rally or Temporary Relief? (June 2026)

By WebDeskJune 16, 20263 Mins Read
BTC Holds Firm Above K: Sustainable Rally or Temporary Relief? (June 2026)
Share
Facebook Twitter LinkedIn Pinterest Email

The Bitcoin price is still rallying, having climbed above the major horizontal resistance at $66K. Can the bulls hold onto these gains and push this rally higher, or is this just temporary relief before this bear market resumes once again?

USDT Dominance about to signal end to the rally

Source: TradingView

Before looking at the $BTC price, it is a good idea to have a look at USDT Dominance. The higher USDT Dominance goes, the more money is sidelined rather than going into Bitcoin. This is predominantly the case in a bear market. 

The above daily chart shows that USDT Dominance is having its own bull market. A breakout of the long-time descending triangle was significant, and the couple of bull flags since then have propelled the USDT Dominance almost back to the highs. Currently, USDT Dominance is testing and perhaps confirming the support at 8.2%. If it goes higher, $BTC probably descends back into the bear market, or if it falls through the support, $BTC continues to rally.

Bear pennant becomes bear flag?
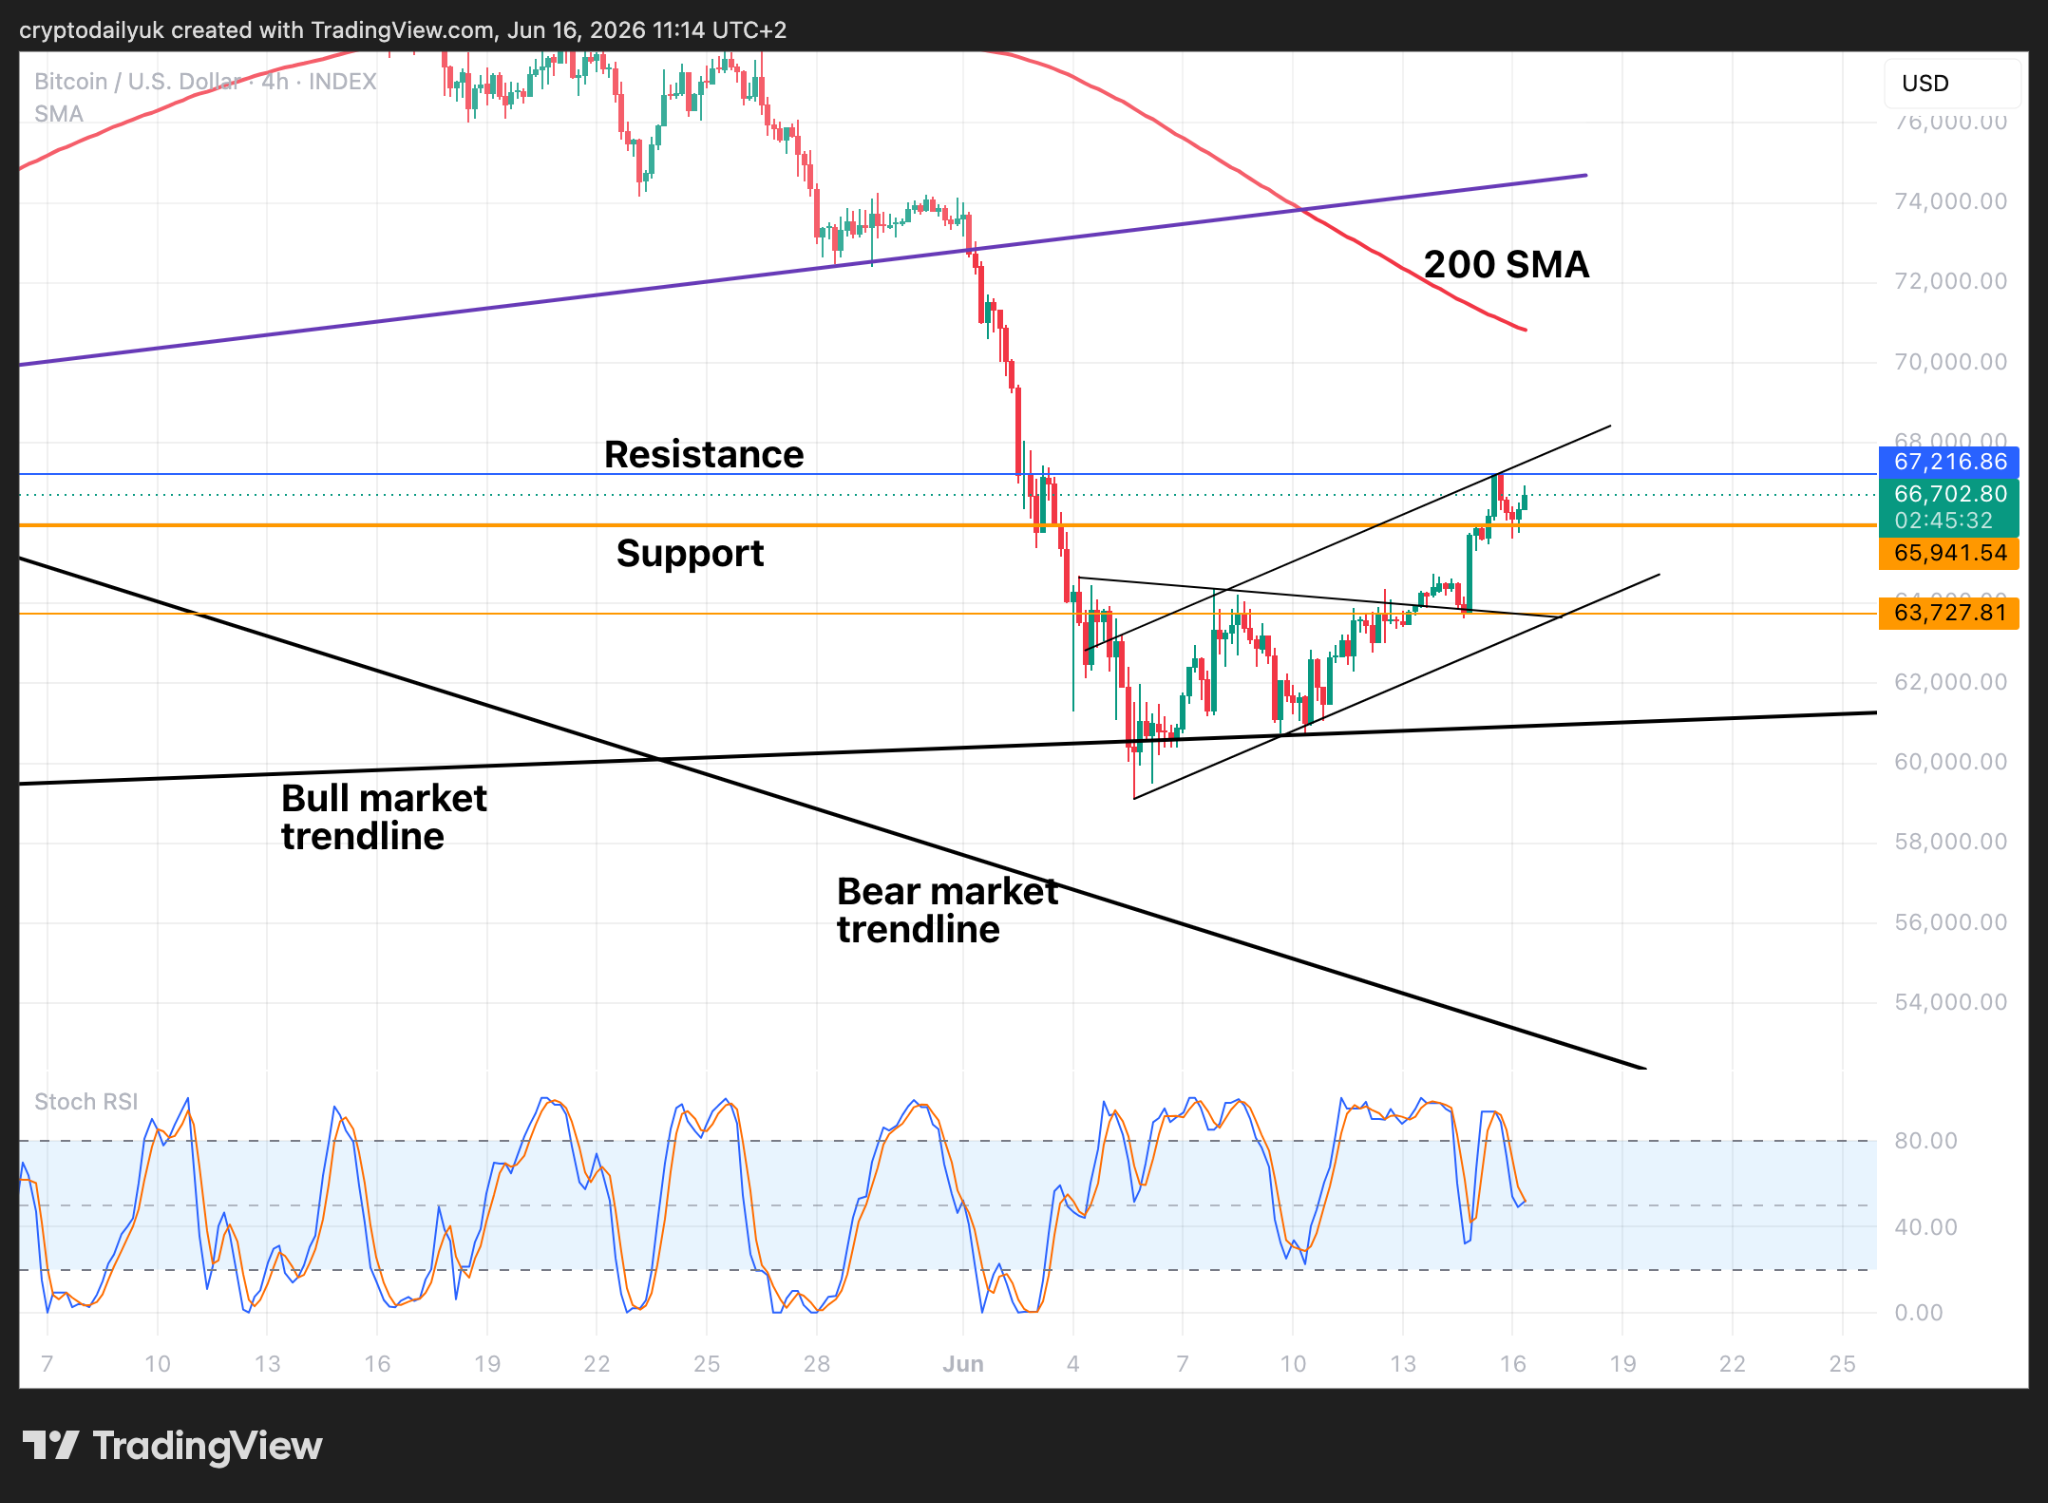
Source: TradingView

The short-term time frame for the $BTC price reveals how the bear pennant bullishly broke to the upside, taking the price as far as $67,200. However, could it be that the bear pennant was only the first part of a bear flag? The price action throughout the rest of Tuesday is likely to confirm the presence of this bear flag.

It just seems that whenever the $BTC price goes on a rally, a bearish structure begins to form that eventually brings the price back down. The full measured move out of this potential bear flag would bring the price down to within a whisker of a retest of the bear market trendline. It would make perfect sense for this to happen, and would take the price down to the low $50K area.

$BTC price approaches breakdown/continuation point

Source: TradingView

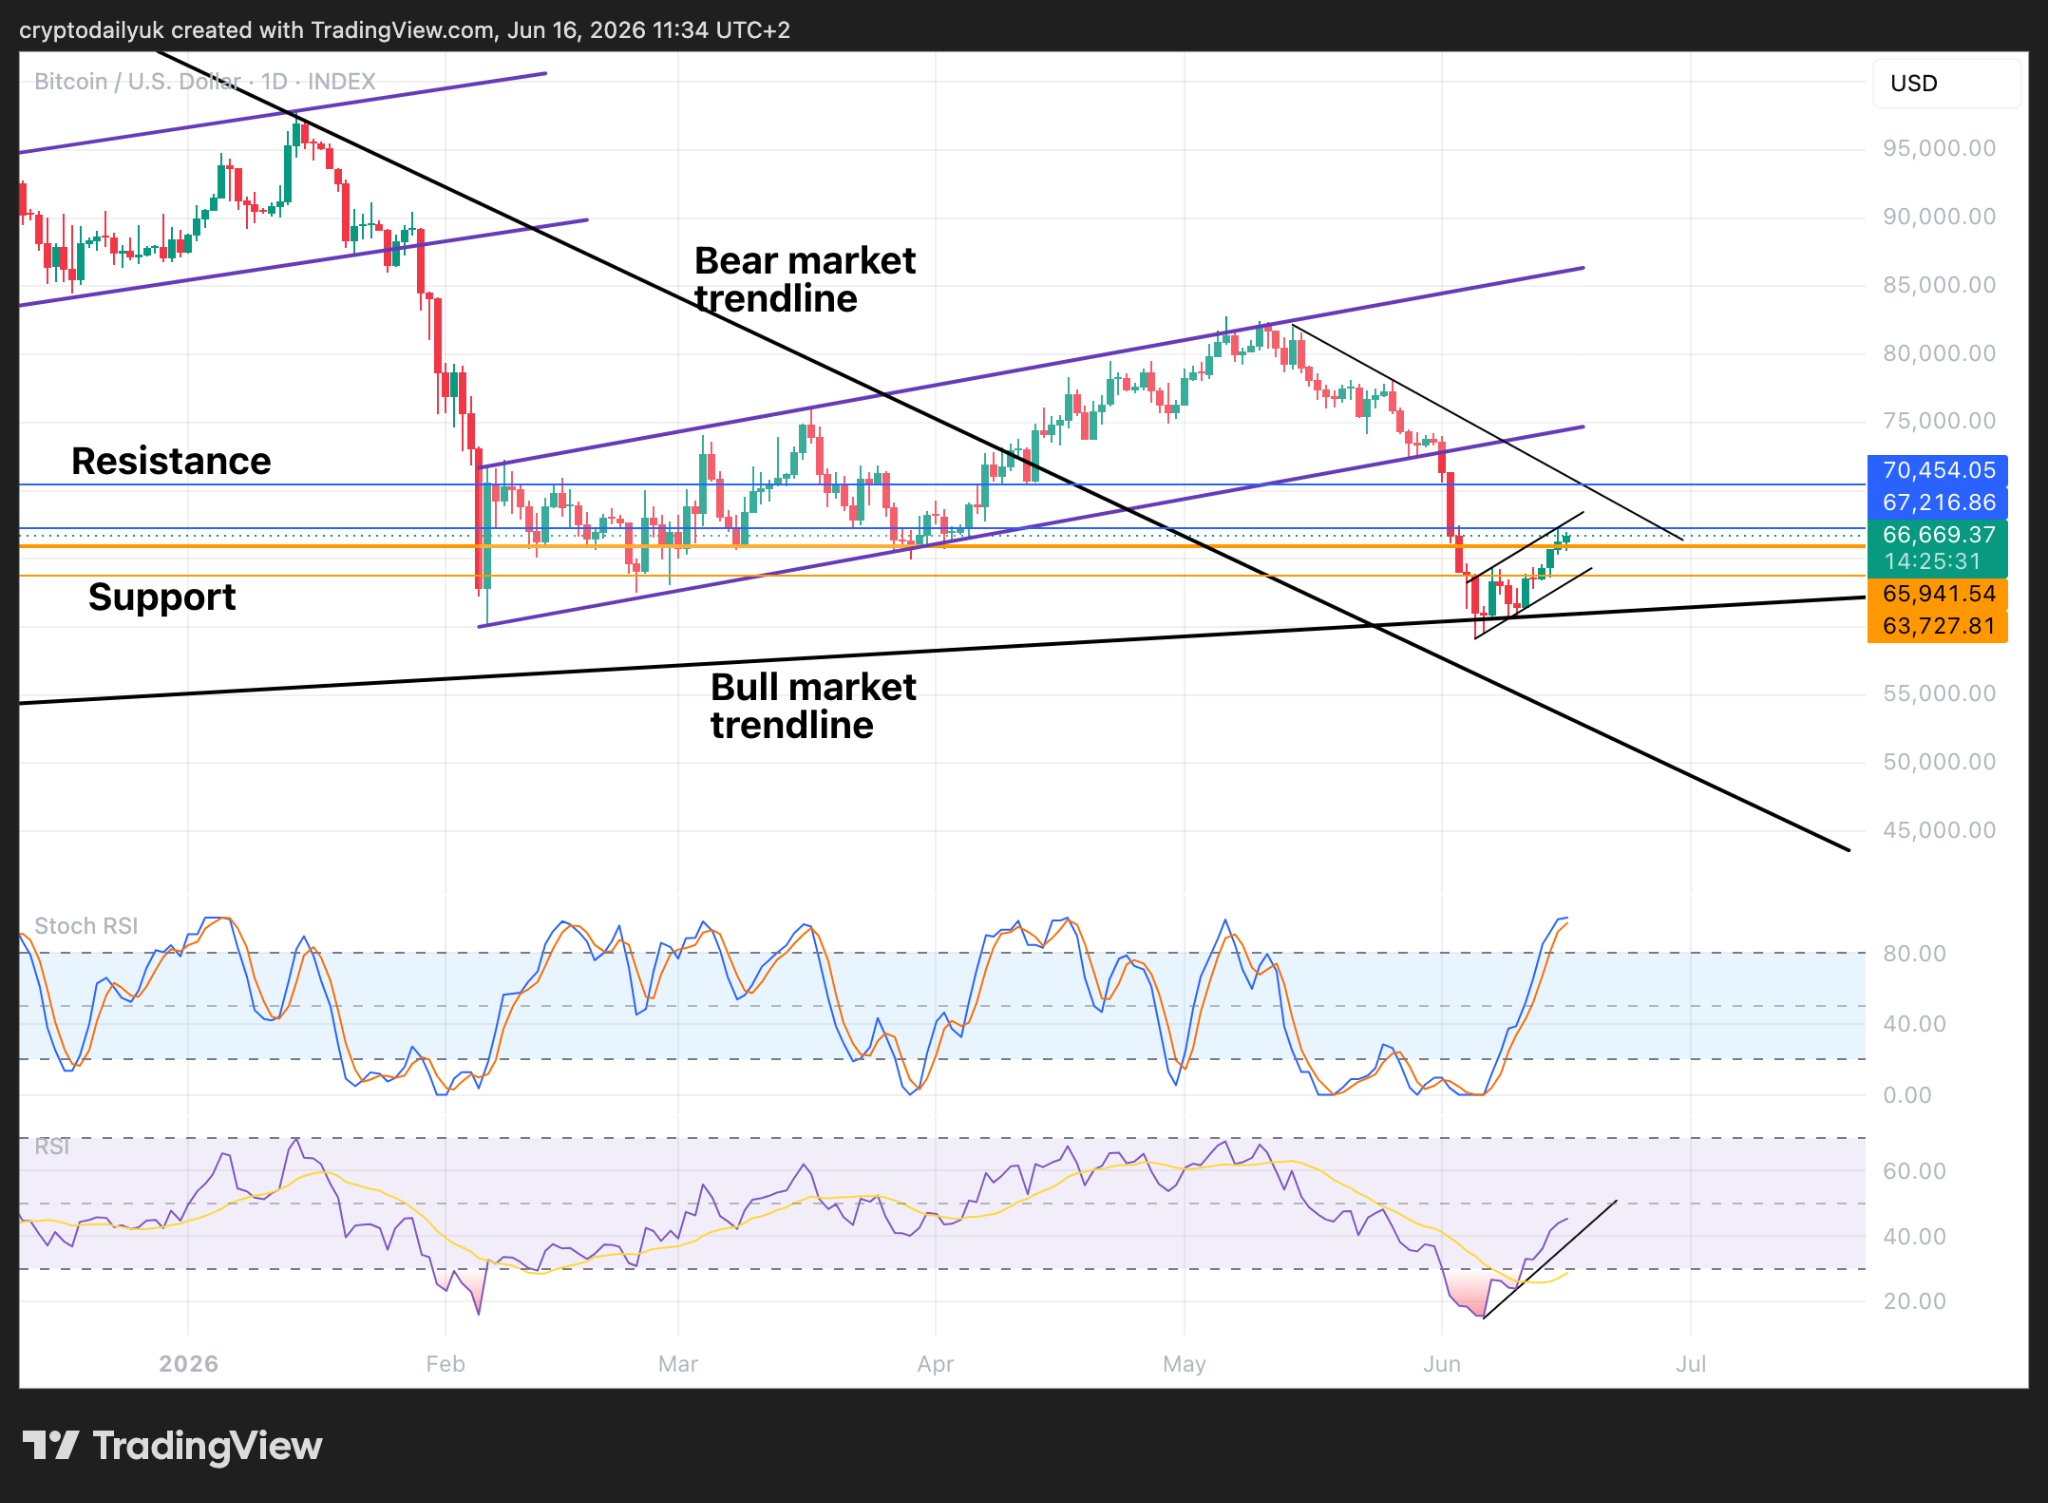
The daily chart adds a bit more clarity to the picture. The $BTC price can be seen climbing up inside the flag. If the price continues to rise, it may come up against the descending trendline, where a breakout or rejection might have a big say in whether the rally continues or breaks down.

At the bottom of the chart, first the Stochastic RSI indicators look as though they are about to roll over, and then the RSI tells us that the rally continues as long as the indicator line stays above the ascending trendline.

A continuation of the bear market into Q4

Source: TradingView

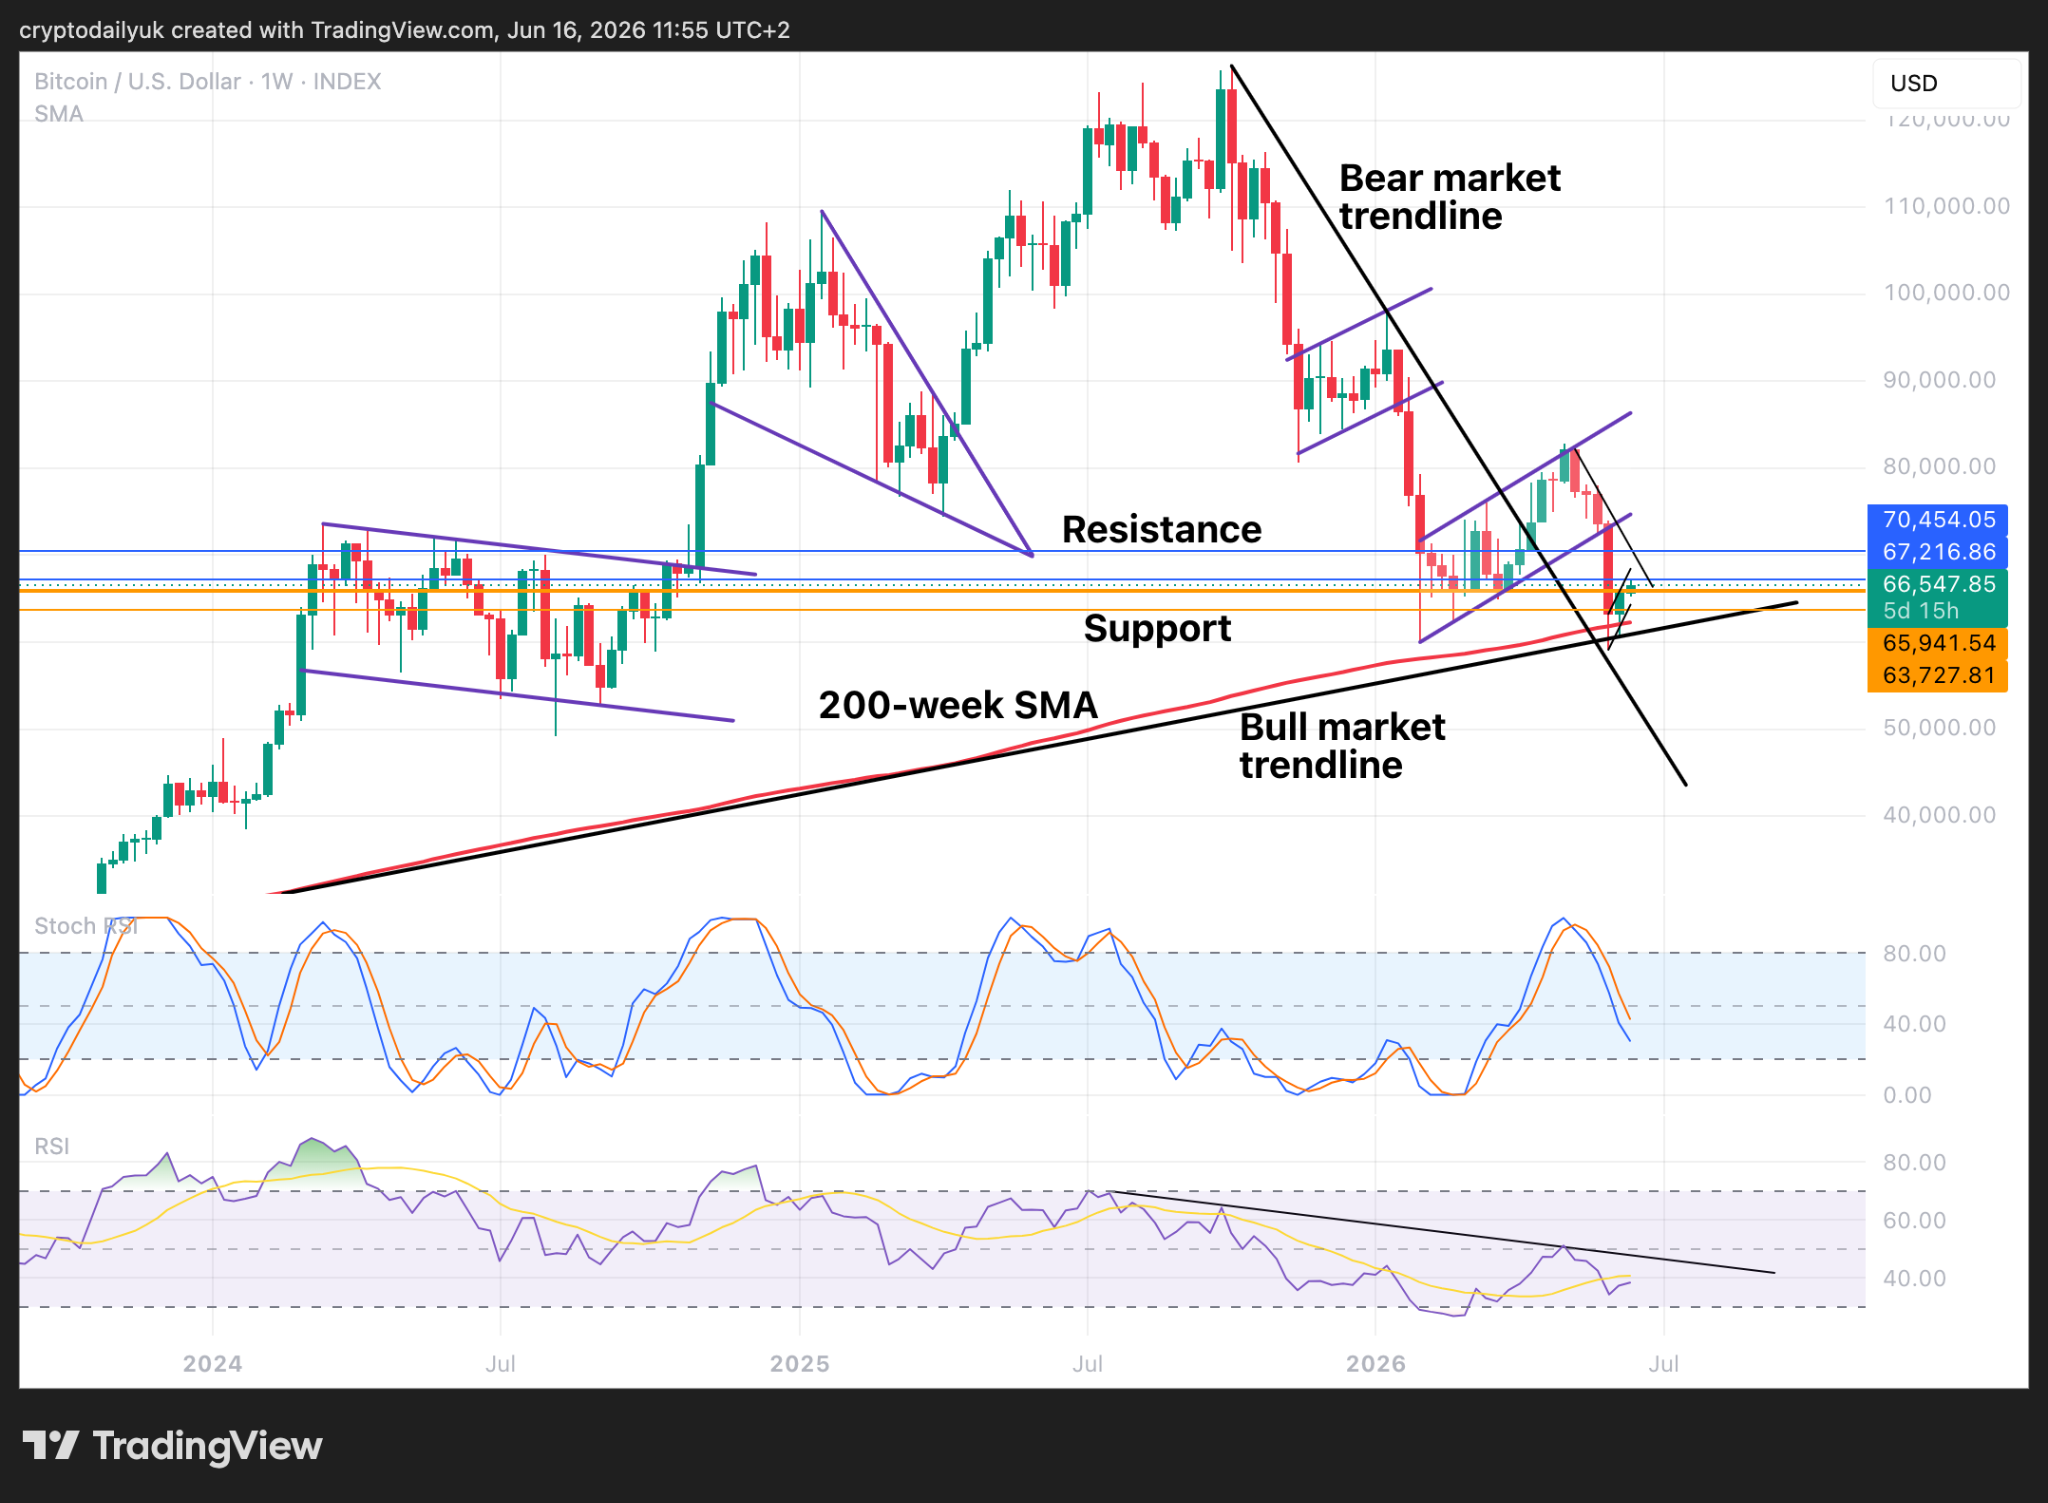
If it were not for the time aspect of this bear market; that is it still has around another 4 months before it would potentially end, a bottom at this point looks very feasible indeed. Be that as it may, the current bear flag suggests that there is still some downside to come. 

The Stochastic RSI indicators in this high time frame are still coming down, and the RSI indicator at the bottom of the chart would need to pierce through the descending trendline before a bull market could get started.

Therefore, the probabilities are still for a continuation of the bear market, albeit not for too much longer. One last correction down to test and confirm the bear market trendline could be the signal of the start of the new bull market. We could also witness some chopping around sideways into the final quarter of the year, but once the Stochastic RSI and the RSI signal a bottom, that could well be it. 

Disclaimer: This article is provided for informational purposes only. It is not offered or intended to be used as legal, tax, investment, financial, or other advice.

Credit: Source link

Previous Article‘Time to Revisit’ US Accredited Investor Laws
Next Article Ripple CEO Reveals Why Banks Aren’t Embracing XRP at Scale

Related Posts

Ethereum Exchange Reserves Hit a 10-Year Low—Is a Supply Shock Brewing?

June 16, 2026

Can Bulls Sustain the Momentum?

June 16, 2026

Bittensor Benefits as Anthropic Faces Regulatory Scrutiny

June 16, 2026
Add A Comment
Leave A Reply Cancel Reply

Top Posts

Ethereum Exchange Reserves Hit a 10-Year Low—Is a Supply Shock Brewing?

June 16, 2026

Ethereum Clear Signing Push Aims To Make Wallet Approvals Safer

June 16, 2026

Ripple CEO Reveals Why Banks Aren’t Embracing XRP at Scale

June 16, 2026

Subscribe to Updates

Get the latest Crypto, Blockchain and Airdrop News from us to Catch The Bull.

Advertisement Banner

Welcome to CatchTheBull, your trusted source for the latest Crypto News and Airdrops. We bring you real-time updates, expert insights, and opportunities to stay ahead in the crypto world. Discover trending projects, market analyses, and airdrop details all in one place.

Join us on this journey to navigate the ever-evolving blockchain universe!

Facebook X (Twitter) Instagram YouTube
Top Insights

Ethereum Research Proposal Targets Post-Quantum Wallet Security At Low Gas Cost

Robert Kiyosaki Doubles Down on Bitcoin as He Says Gold Is Headed to $35K – Bitcoin News

Bittensor Benefits as Anthropic Faces Regulatory Scrutiny

Get Informed

Subscribe to Updates

Get the latest Crypto, Blockchain and Airdrop News from us to Catch The Bull.

© 2026 CatchTheBull. All Rights Are Reserved.
  • Contact Us
  • Privacy Policy
  • Terms of Use
  • DMCA

Type above and press Enter to search. Press Esc to cancel.

  • bitcoinBitcoin(BTC)$66,048.00-0.48%
  • ethereumEthereum(ETH)$1,796.82-0.63%
  • tetherTether(USDT)$1.00-0.01%
  • binancecoinBNB(BNB)$606.26-3.18%
  • rippleXRP(XRP)$1.23-0.68%
  • usd-coinUSDC(USDC)$1.00-0.01%
  • solanaSolana(SOL)$73.890.70%
  • tronTRON(TRX)$0.317024-0.58%
  • Figure HelocFigure Heloc(FIGR_HELOC)$1.031.27%
  • HyperliquidHyperliquid(HYPE)$75.7413.19%
  • dogecoinDogecoin(DOGE)$0.087462-2.75%
  • USDSUSDS(USDS)$1.000.01%
  • leo-tokenLEO Token(LEO)$9.73-0.02%
  • RainRain(RAIN)$0.0139172.52%
  • zcashZcash(ZEC)$505.97-3.45%
  • stellarStellar(XLM)$0.2243096.25%
  • cardanoCardano(ADA)$0.177027-5.82%
  • whitebitWhiteBIT Coin(WBT)$54.31-0.07%
  • moneroMonero(XMR)$339.94-1.27%
  • CantonCanton(CC)$0.163549-0.60%
  • chainlinkChainlink(LINK)$8.25-2.18%
  • USD1USD1(USD1)$1.000.00%
  • Ethena USDeEthena USDe(USDE)$1.000.00%
  • the-open-networkGram (prev. Toncoin)(GRAM)$1.67-5.91%
  • bitcoin-cashBitcoin Cash(BCH)$216.54-4.86%
  • daiDai(DAI)$1.000.00%
  • LABLAB(LAB)$13.2233.96%
  • MemeCoreMemeCore(M)$3.094.23%
  • hedera-hashgraphHedera(HBAR)$0.081461-1.75%
  • litecoinLitecoin(LTC)$45.07-1.88%
  • suiSui(SUI)$0.79-3.82%
  • nearNEAR Protocol(NEAR)$2.39-4.00%
  • Circle USYCCircle USYC(USYC)$1.130.00%
  • avalanche-2Avalanche(AVAX)$6.84-1.19%
  • shiba-inuShiba Inu(SHIB)$0.000005-2.29%
  • crypto-com-chainCronos(CRO)$0.061166-2.17%
  • paypal-usdPayPal USD(PYUSD)$1.000.04%
  • Global DollarGlobal Dollar(USDG)$1.000.03%
  • tether-goldTether Gold(XAUT)$4,314.01-0.68%
  • BittensorBittensor(TAO)$262.74-3.72%
  • BlackRock USD Institutional Digital Liquidity FundBlackRock USD Institutional Digital Liquidity Fund(BUIDL)$1.000.00%
  • worldcoin-wldWorldcoin(WLD)$0.655.60%
  • Ondo US Dollar YieldOndo US Dollar Yield(USDY)$1.140.88%
  • pax-goldPAX Gold(PAXG)$4,324.27-0.69%
  • World Liberty FinancialWorld Liberty Financial(WLFI)$0.060327-0.94%
  • mantleMantle(MNT)$0.58-1.02%
  • uniswapUniswap(UNI)$3.0212.34%
  • OndoOndo(ONDO)$0.375656-2.35%
  • AsterAster(ASTER)$0.662.93%
  • polkadotPolkadot(DOT)$1.01-1.65%