

If you spend enough time in crypto trading chats, one phrase always comes up. Moving averages. Traders argue about them daily. Some swear by them, others dismiss them. But whether you love them or not, they matter.
I’ve used moving averages since my early Bitcoin trades. They help me see through the noise. In this guide, we’ll break them down. We’ll explore simple moving averages (SMA), exponential moving averages (EMA), and those famous crossover signals like the Golden Cross and Death Cross.
By the end, you’ll know how to use them in your trading, and when to ignore them.
This is part 15 of a series of trading guides
What is a Moving Average?
A moving average is a technical indicator that smooths price action. Instead of looking at every small up and down, it shows the average price over a set time.
For example, a 50-day moving average is the average closing price of the last 50 days. Each day, the newest price is added, and the oldest is dropped. That’s why we call it “moving.”
Moving averages help traders identify trends. They filter out short-term noise, making it easier to see the bigger picture.
Simple Moving Average (SMA)
The simple moving average is the most basic version. You add up the last X closing prices, then divide by X.
Traders use different lengths. A 10-day SMA reacts quickly to price changes. A 200-day SMA is slow and shows the long-term trend.
For crypto, the 50-day and 200-day SMAs are popular. Many traders watch these levels for support and resistance. When Bitcoin dips, people often ask: “Is it still above the 200-day SMA?”
Exponential Moving Average (EMA)
The exponential moving average is similar but gives more weight to recent prices. That makes it react faster than the SMA.
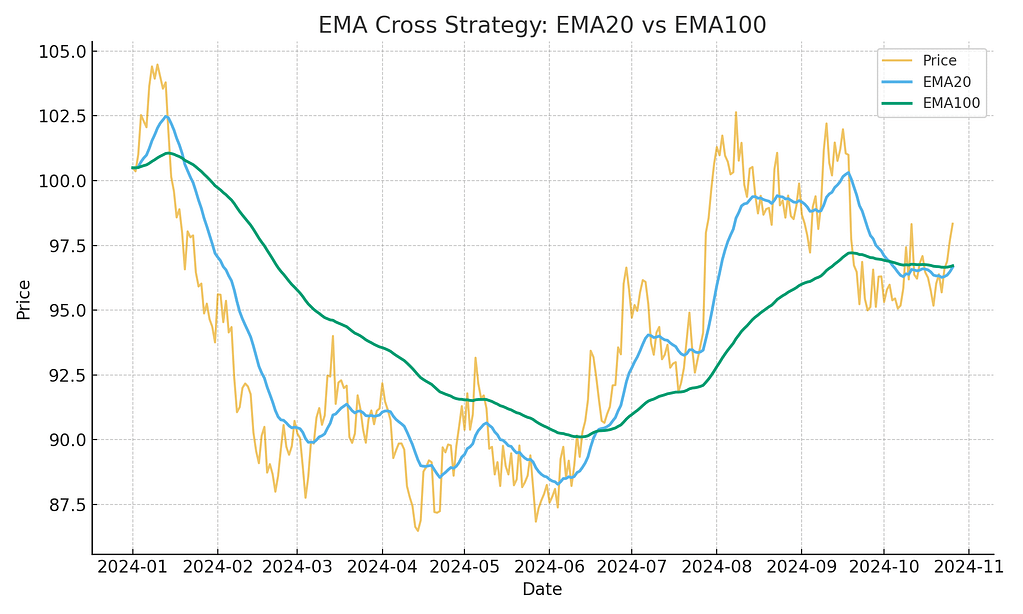
For volatile markets like crypto, EMA can be more useful. A 20-day EMA might hug the price action closely, while a 100-day EMA gives a broader view.
Traders often combine both. An EMA for quick reactions, and an SMA for the bigger trend.
Golden Cross: A Bullish Signal
The Golden Cross happens when the short-term moving average crosses above the long-term moving average.
The classic example is the 50-day SMA crossing above the 200-day SMA. Traders see this as a strong bullish sign. It suggests momentum is shifting upward.
In Bitcoin history, Golden Crosses often happened before big rallies. Not always, but often enough to attract attention.
Death Cross: A Bearish Signal
The Death Cross is the opposite. The short-term moving average crosses below the long-term moving average.
When this happens, many traders expect a bearish trend. It signals weakness and potential downside.
But in crypto, Death Crosses are tricky. Sometimes they happen after most of the drop already occurred. That’s why context matters.
Start trading with us and follow our trading content.
Common Trading Strategies with Moving Averages
1. Trend Following
Stay long when price is above the 200-day SMA. Stay cautious when it is below. Simple, but effective for many traders.
2. Support and Resistance
Moving averages often act as dynamic support and resistance. Price bounces off them repeatedly. Many traders buy dips near the 50-day or 100-day EMA.
3. Crossovers for Entry and Exit
Some traders use the Golden Cross and Death Cross to time trades. Others use faster settings like the 9-day EMA crossing the 21-day EMA.

Strengths of Moving Averages
Moving averages are simple and easy to understand. They give clear signals in trending markets. They also help filter noise, which is valuable in crypto’s wild swings.
They can guide position sizing. If price is far above the 200-day SMA, the market might be overheated. If it’s far below, maybe it’s oversold.
Weaknesses of Moving Averages
Moving averages lag. They don’t predict the future. They follow price. In sideways markets, they can give false signals.
The Golden Cross and Death Cross can be late. By the time they flash, the move might already be done.
That’s why moving averages should not be used alone. They work best when combined with volume, RSI, or support and resistance analysis.
My Experience with Moving Averages
I remember trading Ethereum back in 2017. I kept an eye on the 50-day SMA. Whenever ETH bounced from it, the rally continued. When it broke below, I knew to reduce risk.
I still use moving averages today. They help me spot momentum shifts. But I’ve also learned not to trust them blindly. Crypto moves fast. You need to combine them with other tools.
Support Our Work
If you found this helpful, consider signing up on BloFin (Non-KYC) or Bybit using our referral links. Your support keeps this content free and flowing.
Conclusion
The moving average is a classic tool that traders have used for decades. In crypto, it remains powerful but imperfect.
SMA and EMA smooth the noise and highlight the trend. Golden Crosses and Death Crosses give strong signals, but they lag. Use them as guides, not crystal balls.
Whether you are new or experienced, mastering the moving average will improve your trading. It gives you structure in a market that often feels chaotic.
So, next time you open a chart, add a moving average. Watch how price reacts around it. You might be surprised how often the market respects these lines.
If you enjoyed this blog, check out our guide on Top patterns.
As always, don’t forget to claim your bonus below on Bybit. See you next time!

Credit: Source link


