

The crypto market has been on a wild run lately. Bulls are charging, memes are pumping, and portfolios are glowing green. But as every experienced trader knows—what goes up must eventually come down.
In this guide, we’ll show you how to spot the end of a bull market using three reliable chart patterns. These “top patterns” help you prepare for trend reversals before it’s too late. Even if you’re new to trading, you’ll understand them easily by the end of this read.
Let’s dive in.
This is part 15 of a series of trading guides
Why You Should Learn to Spot Market Tops
No bull market lasts forever. Whether it’s Bitcoin, Tesla, or the S&P 500, markets move in cycles. If you’re only focused on upside, you risk holding too long.
Learning to spot reversal patterns helps you:
- Lock in profits before the drop
- Avoid becoming exit liquidity
- Plan short trades or hedge your exposure
And the best part? You don’t need to be a chart wizard. You just need to know what to look for.
1. Double Top: The Classic Reversal
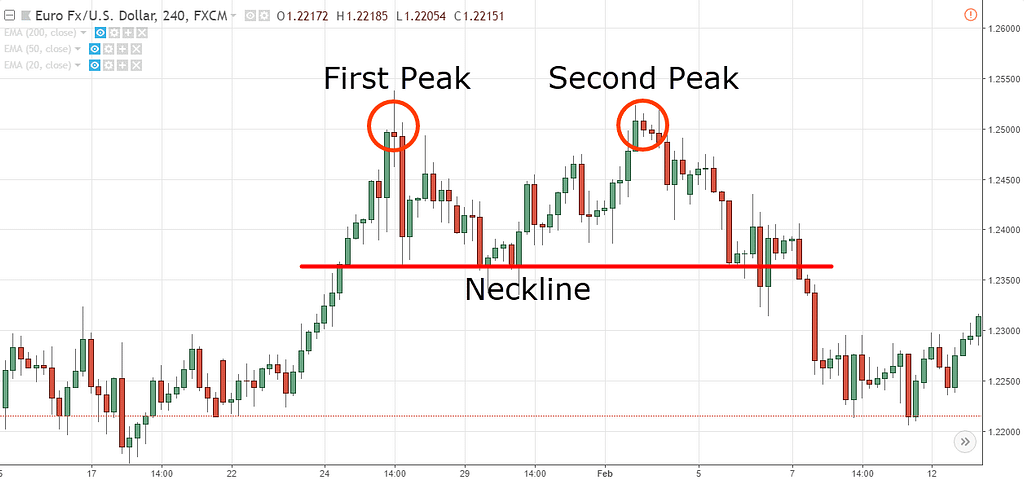
The double top is one of the easiest patterns to recognize. It looks like the letter “M” on a price chart.
What It Looks Like:
- Price hits a peak and then pulls back
- It rallies again, hitting a similar high
- But it fails to break higher the second time
- Then price drops below the “neckline,” confirming the reversal
This pattern shows that buyers are exhausted. They tried twice to push higher and failed both times.
When to Pay Attention:
- You see equal highs, usually on the weekly chart
- Volume is lower during the second top
- The neckline support starts to weaken
When price breaks below that neckline with strong volume, it’s usually time to reduce long positions.
2. Head and Shoulders: The King of Top Patterns
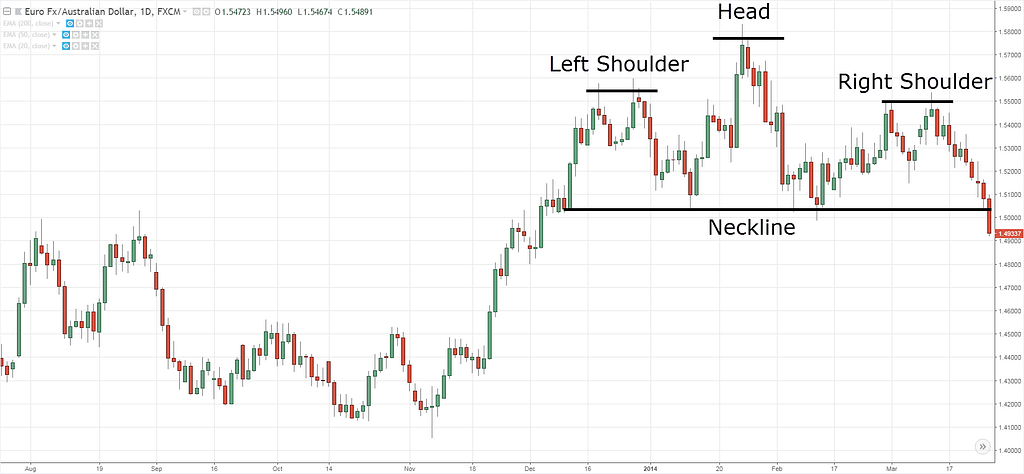
This is arguably the most powerful bearish reversal pattern. It signals a change from uptrend to downtrend with a very clear structure.
What It Looks Like:
- A peak (left shoulder), followed by a higher peak (head)
- Then another smaller peak (right shoulder)
- A neckline connects the lows between the peaks
- When the neckline breaks, the pattern is complete
This one is very reliable on the weekly and monthly charts. It takes time to form but is worth the wait.
Key Signs to Watch:
- The right shoulder forms lower than the head
- Volume declines on each rally
- Breakdown happens with strong momentum
This pattern often marks the end of a macro bull cycle. Once the neckline breaks, it can fall fast.
3. Parabolic Curve Breakdown: The Bubble Popped
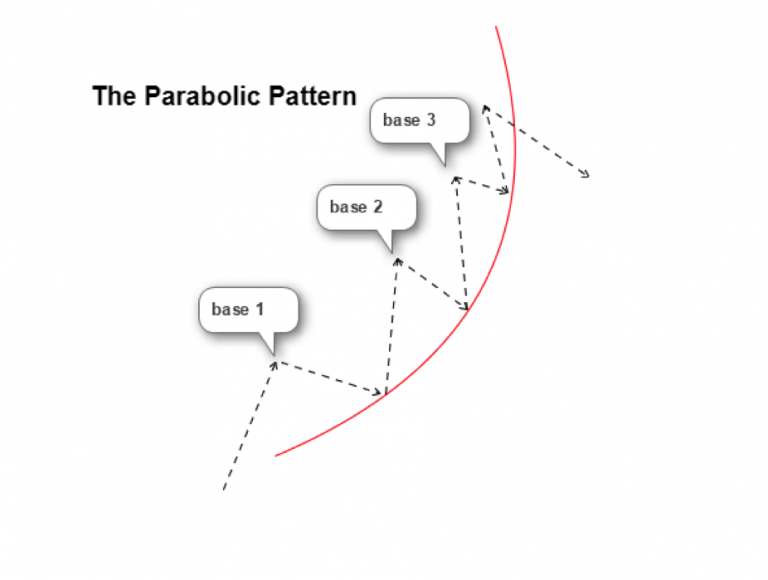
Everyone loves a parabolic run—until it breaks. This pattern happens when prices go vertical, driven by hype and FOMO.
What It Looks Like:
- Price follows an upward curving line
- Each dip is smaller than the last
- Then one day, it breaks down hard
- The curve is gone, and panic begins
This is common in crypto bull runs, meme stocks, and high-volatility assets.
How to Spot It:
- Chart looks like a steep rollercoaster climb
- Volume starts fading at the top
- A sharp red candle breaks the curve
Once the parabola breaks, recovery is usually slow. A lot of traders get trapped holding the top.
Bonus Signals to Confirm a Top
While patterns are helpful, it’s smart to use other tools for confirmation. Here are a few extra signals that often show up during tops:
- RSI Bearish Divergence: Price makes higher highs, but RSI makes lower highs.
- MACD Crossover: The MACD line crosses below the signal line on high timeframes.
- Volume Climax: Giant green candles followed by low-volume chop. The party is over.
These tools give extra confidence that the top patterns are not false signals.
Real Market Examples
Let’s quickly look at real-world examples of each pattern.
Bitcoin 2021 Double Top
Bitcoin hit $64K in April 2021, pulled back, and hit $69K in November. Then it crashed below $50K. Classic double top.
Ethereum 2018 Head and Shoulders
During the 2017-2018 run, ETH formed a textbook head and shoulders before it dropped 90%. Traders who saw it saved themselves.
Dogecoin 2021 Parabolic Curve
DOGE went from $0.01 to $0.70 in weeks. Then the curve snapped. It never recovered to those highs.
These examples show how powerful top patterns can be for long-term moves.

What Should You Do When You Spot a Top?
It depends on your strategy, but here are some options:
- Take partial profits: No one goes broke locking in gains.
- Tighten your stop losses: Protect what you’ve earned.
- Use hedging tools: Options or short positions can balance your exposure.
- Switch to stablecoins or cash: Sit out until a new trend starts.
Most importantly, don’t ignore the signs. Tops are loud if you know how to listen. deep 🌪.
Summary Table
| Pattern | Signal that Bull Market Is Ending | Key Confirmation |
|---|---|---|
| Double Top | Break below neckline after two similar peaks | Price break + volume surge |
| Head & Shoulders Top | Drop below neckline following three-peak structure | Falling volume on shoulders + volume spike on breakdown |
| Parabolic Curve Breakdown | Break of upward-sloping curved support often signals collapse | Sharp loss of curve support and heavy selling |
Tips for Traders
- Set protective stops just above the right shoulder (H&S) or above neckline retests.
- Use longer timeframes (weekly/monthly) for higher reliability.
- Confirm volume dynamics: weakening at peaks, surge on breakdown.
- Combine with tools like RSI bearish divergence or MACD crossovers to confirm momentum shift. Bitcoin.
Support Our Work
If you found this helpful, consider signing up on BloFin (Non-KYC) or Bybit using our referral links. Your support keeps this content free and flowing.
Final Thoughts
Bull markets are fun. But if you want to stay in the game, learning to spot the end is key. These three top patterns—double tops, head and shoulders, and parabolic curve breakdowns—are your early warnings.
They won’t catch every top. But when they do appear on the weekly or monthly chart, take them seriously. Add volume and RSI for confirmation, and you’ll be one step ahead of the crowd.
Whether you’re a new trader or a seasoned one, spotting a top is a skill worth learning.
If you enjoyed this blog, check out the last trading guide on candlestick strategy.
As always, don’t forget to claim your bonus below on Bybit. See you next time!

Credit: Source link


