Close Menu
CatchTheBullCatchTheBull
  • Home
  • Crypto News
  • Bitcoin
  • Altcoin
  • Blockchain
  • Airdrops News
  • NFT News
What's Hot

Here’s What The Price Is Really Headed

March 24, 2026

Markets Flip Script as Fed Hike Odds Overtake Cuts for First Time in 2026 Cycle

March 23, 2026

Anthropic Launches Claude Computer Control Feature for Mac Users

March 23, 2026
Facebook X (Twitter) Instagram
CatchTheBullCatchTheBull
  • Home
  • Crypto News
  • Bitcoin
  • Altcoin
  • Blockchain
  • Airdrops News
  • NFT News
CatchTheBullCatchTheBull
Bitcoin

Ethereum Monthly RSI At 2018 Market Low — What Happened Last Time?

By WebDeskMarch 30, 20253 Mins Read
Ethereum Monthly RSI At 2018 Market Low — What Happened Last Time?
Share
Facebook Twitter LinkedIn Pinterest Email

Trusted Editorial content, reviewed by leading industry experts and seasoned editors. Ad Disclosure

The price of Ethereum appeared to be back on its way to recovery, reclaiming the psychological $2,000 level earlier in the week. However, the altcoin was among the crypto assets heavily impacted by the latest inflation data in the United States, returning below $2,000.

This latest correction highlights the struggles of the Ethereum price over the past few months, underperforming even in the midst of a market-wide bull run. Interestingly, a prominent indicator has flashed the imminence of a bottom for the second-largest cryptocurrency.

Is ETH Ready For A Rebound?

In a March 28 post on the X platform, Chartered Market Technician (CMT) Tony Severino shared that a critical indicator for the Ethereum price is at 2018 bear market levels. The crypto expert suggested that the altcoin could be gearing up for a rebound from its recent lows.

This analysis is based on recent changes in the 1-month relative strength index (RSI) indicator on the Ethereum monthly chart. The relative strength index is a momentum indicator used in technical analysis to measure the speed and magnitude of an asset’s price changes.

The RSI oscillator is used to detect whether an asset is being overbought or oversold, indicating the tendency of a trend/price reversal. Typically, an RSI reading of over 70 signals an overbought market condition, while a relative strength index value below 30 suggests an oversold condition.

According to Severino, the monthly Ethereum RSI indicator is currently at a value last seen during the bear market in 2018. As observed in the chart below, the indicator also reached this bottom following the crypto market capitulation events in May and November 2022.

Ethereum

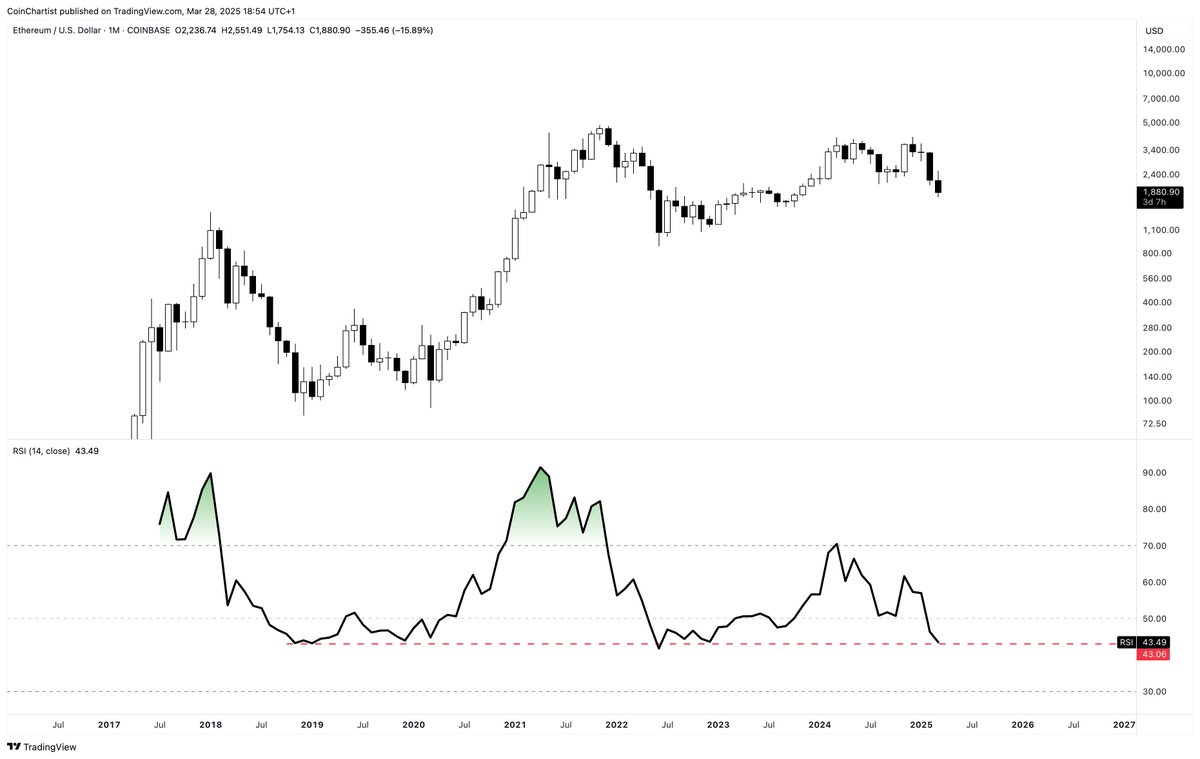
Source: @tonythebullBTC on X

After reaching this level, the relative strength index and price of ETH tend to bounce back to new highs. In the 2018 cycle, the Ethereum price surged by nearly 4,000% from around $120 to the current all-time high of $4,878. 

Meanwhile, the altcoin returned to around this record-high price in early 2024 after reaching this RSI bottom in 2022. If history were to repeat itself, the price of ETH could bounce back from its current point to a new high.

However, Severino highlighted in his post that the monthly Ethereum RSI bottom in 2018 came after the price dropped roughly 94% from its then all-time high. The price of ETH is only 56% adrift from the local high and 63% from its current record high. Hence, it remains to be seen whether the Ethereum price is at risk of further decline.

Ethereum Price At A Glance

As of this writing, the price of ETH is around $1,880, reflecting an almost 7% decline in the past 24 hours.

Ethereum

The price of ETH on the daily timeframe | Source: ETHUSDT chart on TradingView

Featured image from Unsplash, chart from TradingView

Editorial Process for bitcoinist is centered on delivering thoroughly researched, accurate, and unbiased content. We uphold strict sourcing standards, and each page undergoes diligent review by our team of top technology experts and seasoned editors. This process ensures the integrity, relevance, and value of our content for our readers.

Credit: Source link

Previous ArticleTrump pardons BitMEX, is ‘Bitcoin Jesus’ Roger Ver next?
Next Article Bitcoin Short-Term Holders In Extreme Panic And Fear — What This Means

Related Posts

Here’s What The Price Is Really Headed

March 24, 2026

Markets Flip Script as Fed Hike Odds Overtake Cuts for First Time in 2026 Cycle

March 23, 2026

Only 5% of altcoins beat the 200‑day as volume collapses 80%

March 23, 2026
Add A Comment
Leave A Reply Cancel Reply

Top Posts

Here’s What The Price Is Really Headed

March 24, 2026

Markets Flip Script as Fed Hike Odds Overtake Cuts for First Time in 2026 Cycle

March 23, 2026

Anthropic Launches Claude Computer Control Feature for Mac Users

March 23, 2026

Subscribe to Updates

Get the latest Crypto, Blockchain and Airdrop News from us to Catch The Bull.

Advertisement Banner

Welcome to CatchTheBull, your trusted source for the latest Crypto News and Airdrops. We bring you real-time updates, expert insights, and opportunities to stay ahead in the crypto world. Discover trending projects, market analyses, and airdrop details all in one place.

Join us on this journey to navigate the ever-evolving blockchain universe!

Facebook X (Twitter) Instagram YouTube
Top Insights

Asset Managers Want To Pivot Towards Digital Assets

Best Crypto Exchanges in 2026: Low Fees, High Security, Trusted Picks

NVIDIA OpenShell Brings Security Sandbox to Autonomous AI Agents

Get Informed

Subscribe to Updates

Get the latest Crypto, Blockchain and Airdrop News from us to Catch The Bull.

© 2026 CatchTheBull. All Rights Are Reserved.
  • Contact Us
  • Privacy Policy
  • Terms of Use
  • DMCA

Type above and press Enter to search. Press Esc to cancel.

  • bitcoinBitcoin(BTC)$70,568.003.79%
  • ethereumEthereum(ETH)$2,139.444.04%
  • tetherTether(USDT)$1.00-0.01%
  • rippleXRP(XRP)$1.412.16%
  • binancecoinBNB(BNB)$632.750.82%
  • usd-coinUSDC(USDC)$1.000.00%
  • solanaSolana(SOL)$90.364.78%
  • tronTRON(TRX)$0.308677-0.28%
  • Figure HelocFigure Heloc(FIGR_HELOC)$1.031.04%
  • dogecoinDogecoin(DOGE)$0.0934473.17%
  • whitebitWhiteBIT Coin(WBT)$54.582.33%
  • USDSUSDS(USDS)$1.000.00%
  • cardanoCardano(ADA)$0.2597323.36%
  • bitcoin-cashBitcoin Cash(BCH)$473.820.93%
  • HyperliquidHyperliquid(HYPE)$37.48-1.33%
  • leo-tokenLEO Token(LEO)$9.410.95%
  • moneroMonero(XMR)$351.31-1.75%
  • chainlinkChainlink(LINK)$9.064.09%
  • Ethena USDeEthena USDe(USDE)$1.00-0.02%
  • CantonCanton(CC)$0.1472411.50%
  • stellarStellar(XLM)$0.1649945.40%
  • USD1USD1(USD1)$1.00-0.08%
  • daiDai(DAI)$1.00-0.06%
  • litecoinLitecoin(LTC)$55.302.87%
  • RainRain(RAIN)$0.0086380.81%
  • avalanche-2Avalanche(AVAX)$9.545.15%
  • paypal-usdPayPal USD(PYUSD)$1.00-0.07%
  • hedera-hashgraphHedera(HBAR)$0.0926423.33%
  • zcashZcash(ZEC)$227.533.74%
  • suiSui(SUI)$0.943.70%
  • shiba-inuShiba Inu(SHIB)$0.0000065.20%
  • the-open-networkToncoin(TON)$1.335.56%
  • crypto-com-chainCronos(CRO)$0.0760722.76%
  • MemeCoreMemeCore(M)$1.730.49%
  • BittensorBittensor(TAO)$301.3011.47%
  • World Liberty FinancialWorld Liberty Financial(WLFI)$0.1039796.23%
  • Circle USYCCircle USYC(USYC)$1.120.01%
  • tether-goldTether Gold(XAUT)$4,331.33-1.65%
  • polkadotPolkadot(DOT)$1.42-0.49%
  • mantleMantle(MNT)$0.70-1.40%
  • uniswapUniswap(UNI)$3.572.41%
  • pax-goldPAX Gold(PAXG)$4,331.42-1.86%
  • BlackRock USD Institutional Digital Liquidity FundBlackRock USD Institutional Digital Liquidity Fund(BUIDL)$1.000.00%
  • Pi NetworkPi Network(PI)$0.188567-2.76%
  • okbOKB(OKB)$84.65-0.07%
  • Global DollarGlobal Dollar(USDG)$1.000.00%
  • Falcon USDFalcon USD(USDF)$1.00-0.02%
  • nearNEAR Protocol(NEAR)$1.301.95%
  • SkySky(SKY)$0.0724145.15%
  • aaveAave(AAVE)$109.892.71%